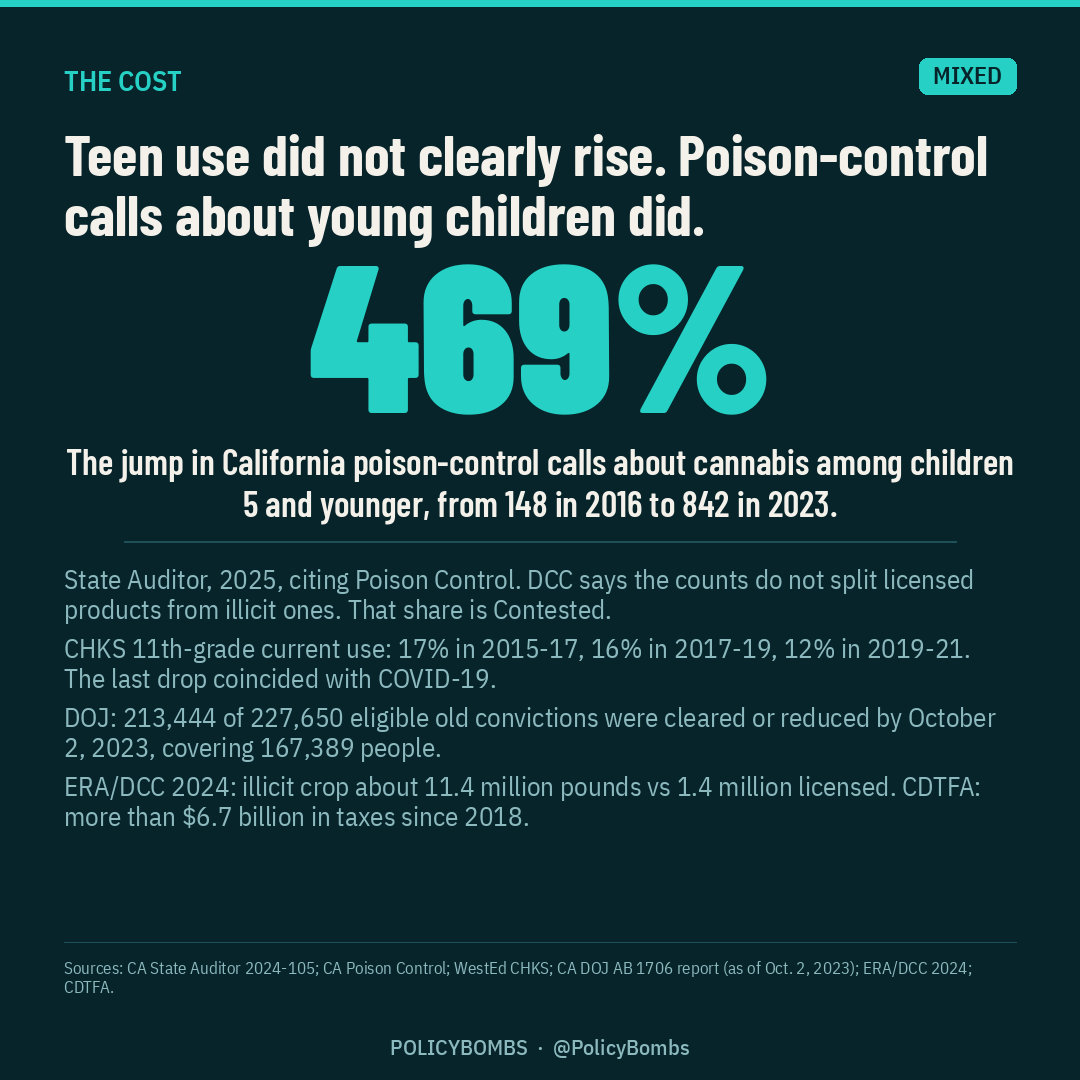
469%. That's the jump in California Poison Control calls about cannabis among children 5 and younger, from 148 in 2016 to 842 in 2023, per the State Auditor. In 2023 there were also 308 cannabis-overdose emergency visits for children under 5. DCC says those counts do not separate licensed products from illicit or unregulated ones. That share is Contested. The rise in calls is not.
California voters legalized marijuana for adults 21 and over in 2016, 57.13% to 42.87%. A taxed, licensed market arrived. More than $6.7 billion in cannabis taxes have been collected since 2018. By October 2, 2023, 213,444 old eligible convictions had been cleared or reduced, covering 167,389 people. Felony marijuana arrests fell from 1,617 in 2018 to 504 in 2023.
Teen survey use did not clearly rise. On the state's Healthy Kids Survey, 11th-grade current use was 17% in 2015-17, 16% in 2017-19, and 12% in 2019-21. That last drop coincided with COVID-19 school closures and should not be credited to the law.
The promise to kill the illicit trade did not hold. The state's 2024 market report put illicit production at about 11.4 million pounds a year versus 1.4 million licensed, about eight to one. As of July 2024, 57% of California's 539 cities and counties still ban retail shops. The Yes campaign outspent No about 14 to 1 ($22.85 million to $1.61 million).
Verdict: MIXED. Legalization, revenue, and record relief, yes. Killing the illicit trade, no. Teen use did not clearly rise. Child poisonings did.
Full analysis
Long-form analysis of California Proposition 64, the 2016 Adult Use of Marijuana Act. Content checked and revised November 12, 2026 (America/Los_Angeles), revision 2. This revision adds sourced answers on youth, impaired driving, who benefited, and redeeming value besides taxes. Finding tags: Substantiated, Partly substantiated, Overstated, Not substantiated, Unverified, Contested, Pending.
Contents
- 10-Minute Lazy Voter Guide
- 1. What is the policy
- 2. Why it exists
- 3. Realized effects
- Youth: what happened after Prop 64
- DUI and impaired driving
- Who benefited from its passing
- Redeeming value besides taxes
- What a good policy would include
- Who supports / who opposes
- 4. Good or bad for society
- References
- Gaps / unverified
10-Minute Lazy Voter Guide
Voters legalized adult-use marijuana in 2016, 57.13% to 42.87%. [1] A taxed, licensed market arrived. More than $6.7 billion in cannabis taxes have been collected since 2018. [4] More than 167,000 people have had old eligible convictions cleared or reduced. [24] The illicit market was not displaced, and most local governments still ban stores. [6,7]
Teen survey use did not clearly rise. Child poison-control calls and emergency visits did. Impaired-driving evidence is mixed and hard to measure. Verdict: MIXED, unchanged from the prior revision.
Proposition 64 legalized possession, cultivation, and sale of cannabis for adults 21 and over, created a licensing and testing system, allowed local regulation and taxation, and dedicated most new state tax revenue to youth programs, environmental cleanup, and law enforcement. [2] It also reduced penalties, including making ordinary under-18 possession of 28.5 grams or less an infraction, and opened a path to clear or reduce old convictions, later made largely automatic by AB 1793 and AB 1706. [24,25] Licensed adult-use sales began in January 2018.
Yes raised $22,849,274; No raised $1,611,469 (Secretary of State, through December 31, 2016). [12] Public supporters included then-Lt. Gov. Gavin Newsom and Rep. Barbara Lee. Public opponents included Sen. Dianne Feinstein and the state District Attorneys Association. [3]
School surveys: CHKS past-30-day use in grades 7, 9, and 11 was 2%, 9%, and 17% in 2015-17; 4%, 10%, and 16% in 2017-19; and 2%, 6%, and 12% in 2019-21. The last drop coincided with COVID-19 school closures and should not be credited to the law. The 2021-23 statewide CHKS is Pending. [11] CDPH's 2023 youth tobacco survey found 10.4% current high school use (8.8% in 2022) and 3.1% among 8th graders. Among current high school users who bought marijuana, 38.3% got it from a store or dispensary. [16]
Child harm: California Poison Control calls about cannabis among children 5 and younger rose from 148 in 2016 to 842 in 2023 (up 469%). Calls among ages 6 to 19 rose from 256 to 633 (up 147%). In 2023 there were 308 cannabis-overdose ED visits for children under 5, 99 for ages 5 to 9, and 328 for ages 10 to 14. [10] DCC notes that these counts do not separate licensed products from illicit or unregulated ones. That share is Contested; the rise in poisonings is Substantiated. [10]
The CHP Impaired Driving Task Force, created after Prop 64, told the Legislature not to enact a per se THC limit, because current science does not support one. [20] An IIHS study of 2009-2019 crash rates found that legalization plus retail sales was associated with a 5.8% increase in injury crash rates and a 4.1% increase in fatal crash rates, on average, across legalizing states including California. Effects varied widely by state. Finding: Contested. [21]
Key numbers: vote 57.13% Yes [1]; taxes more than $6.7 billion since 2018, including $3.5 billion excise [4]; illicit vs legal production about 11.4 million pounds vs 1.4 million [6]; local bans, 57% of 539 cities and counties allow no retail as of July 2024 [7]; record relief, 213,444 of 227,650 eligible cases, 167,389 people, as of October 2, 2023 [24]; felony marijuana arrests, 1,617 in 2018 and 504 in 2023, juvenile felony 128 to 19 [14]; 11th-grade current use 17% (2015-17), 16% (2017-19), 12% (2019-21, COVID-affected) [11].
1. What is the policy
Result: Approved, 57.13% Yes (7,979,041 to 5,987,020). [1] Proposition 64, the Adult Use of Marijuana Act, legalized possession, cultivation, and sale of cannabis for adults 21 and over, created a licensing and testing system, allowed local governments to regulate or ban commercial activity and to add local taxes, and dedicated most new state tax revenue to youth programs, environmental cleanup, and law enforcement. [2] Ordinary under-18 possession of 28.5 grams or less became an infraction, with drug education or counseling and community service. [25] The measure also opened a path to clear or reduce old convictions, later made largely automatic by AB 1793 and AB 1706. [24] Licensed adult-use sales began in January 2018.
2. Why it exists
Stated intent
- Legalize adult use (21+), license growers and sellers, and set product standards. [2]
- Tax cultivation and retail sales, with most revenue dedicated to youth programs, environmental cleanup, and law enforcement. [2]
- Cut criminal justice costs by tens of millions a year by ending most marijuana prosecutions. [2]
- Shrink the illegal market by giving buyers a legal option (proponents' stated goal). [1]
Who supported it, and who paid
Supporters included then-Lt. Gov. Gavin Newsom, Rep. Barbara Lee, and state ACLU and NAACP branches. [3] The California Secretary of State reported $22,849,274 in contributions in support and $1,611,469 in opposition, through December 31, 2016. [12]
On the Yes side, the largest committee totals were New Approach PAC at $7,444,000; Yes on 64, Californians to Control, Regulate and Tax Adult Use of Marijuana While Protecting Children, at $6,881,245; and Fund for Policy Reform, a 501(c)(4), at $6,140,000. [12] The Secretary of State's Quick Guide list of largest gifts includes Sean Parker and affiliated entities at $4,000,000, $1,250,000, and $1,000,000; multiple Fund for Policy Reform gifts of $1,970,000, $1,403,000, $1,000,000, and $550,000; Ghost Management Group, LLC dba Weedmaps at $1,000,000; and Henry van Ameringen at $1,000,000. [2] The Weedmaps-sponsored committee, Californians for Sensible Reform, reported $850,000 in total contributions. [12] News reporting has long associated Fund for Policy Reform with George Soros. [13] That is a secondary attribution, not a line-by-line donor filing in the Secretary of State totals cited above.
Commercial interest (Yes): Weedmaps stood to gain from a legal retail market. [2,12] This is a disclosed interest, not an allegation of wrongdoing.
Who opposed it
Opponents included Sen. Dianne Feinstein, the California Republican and Libertarian parties, and the state District Attorneys Association. [3] The largest No committee was SAM Action, Inc., a Committee Against Proposition 64, at $1,364,000. [12] The Quick Guide lists Julie Schauer gifts of $1,000,000, $150,000, $120,000, and smaller amounts; also $25,000 each from the California Teamsters public affairs council, PORAC, and a Jim Cooper ballot-measure committee, and $12,500 from the California Association of Highway Patrolmen. [2] Institutional interest (No): law enforcement associations whose enforcement role shrinks under legalization funded the No side. [2] This is a disclosed interest, not an allegation of wrongdoing.
3. Realized effects
Testing the original claims
| Claim | Test | Finding |
|---|---|---|
| Revenue of high hundreds of millions to over $1 billion a year [2] | LAO projects $653 million in excise revenue for 2024-25, $42 million below the budget forecast. [5] Cumulative taxes exceed $6.7 billion since 2018. [4] | Partly substantiated. Excise revenue sits at the low end of the original range. |
| Legal sales would undercut the black market [1] | ERA/DCC: illicit production about 11.4 million pounds vs 1.4 million licensed. [6] | Not substantiated. Licensed cultivators still compete with unlicensed supply about eight to one. |
| Reduced criminal justice costs [2] | Official case counts fell. Crime in California 2023 shows felony marijuana arrests from 1,617 in 2018 to 504 in 2023. [14] Dollar savings were not independently audited. | Caseload drop is substantiated. Dollar savings remain Unverified. |
| Nation's strictest protections for children (Yes argument in the voter guide) [2] | School-survey teen use did not clearly rise. Poison-control calls and child emergency visits did. [10,11] | Partly substantiated on teen use. Not substantiated as a clean child-protection record. |
What changed after the vote
| Element | What the record shows | Status |
|---|---|---|
| Legal adult market | Licensed production rose 11.8% in 2024 to about 1.4 million pounds; up more than the year before, still far below illicit volume. | Delivered |
| Tax revenue | Over $6.7 billion in cannabis taxes since January 2018, including $3.5 billion excise. LAO puts 2024-25 excise at $653 million, $42 million below the budget forecast. | Delivered, below the top of the forecast |
| Cultivation tax | Eliminated July 1, 2022 after industry strain; $500.6 million collected before repeal. | Repealed by the Legislature |
| Illicit market | An estimated 11.4 million pounds of illicit cannabis produced in California each year, versus about 1.4 million licensed, about eight to one. | Not achieved |
| Local retail access | As of July 2024, 57% of California's 539 cities and counties did not allow any retail shops. 250 of 539 (46%) allowed at least one type of commercial cannabis activity. | Mostly blocked at the local level |
| Record relief | DOJ identified 227,650 potentially eligible past convictions in July 2019. As of October 2, 2023, 213,444 had been recalled, dismissed, sealed, or redesignated, covering 167,389 people. | Mostly delivered, after later cleanup bills |
| Youth possession penalties | For a person under 18, possession of 28.5 grams or less is an infraction, with drug education or counseling and community service. | Delivered as written |
- January 2018: licensed adult-use sales began.
- 2018-2022: AB 1793 and later AB 1706 created and then tightened automatic review of old cannabis convictions. [24]
- 2022: The Legislature eliminated the cultivation tax (AB 195) and tied a future retail excise increase to offset it; the rate is capped at 19%. [5]
- July 2024: The Department of Cannabis Control reported that 250 of 539 cities and counties (46%) allowed at least one type of commercial cannabis activity, while 289 (54%) allowed none, and 57% allowed no retail. [7]
- 2024-2025: Wholesale and retail prices kept falling; taxes, fees, and compliance make licensed product expensive. [6] A temporary vendor compensation program lets eligible retailers keep 20% of excise due, through December 31, 2025. [4]
- FY 2024-25: DCC's legislative report again notes that nearly two-thirds of cities and counties still do not allow regulated retailers, and describes a Retail Access Grant Program in which several awarded cities later withdrew. [9]
Did it achieve its intended purpose?
MIXED. Legalization, a taxed licensed market, and most of the record-relief caseload delivered. The promise to displace the illicit market did not. Local bans left large parts of the state without a legal storefront. Child-poisoning harms rose even as survey-measured teen use did not clearly increase.
Unintended consequences
High combined taxes and local bans kept many growers and buyers in the illicit market, the outcome the measure was meant to shrink. [6,7] The state had to rework its own tax design within six years (cultivation tax repealed). [4,5] Child edible exposures and cannabis-related emergency visits among young children rose after adult-use sales began. [10,15] The State Auditor found that DCC does not review packaging for attractiveness to children before products go to market, inspected fewer than half of licensees each year since 2022, and does not consistently escalate penalties for repeat packaging violations. [10] DCC's response cautioned that poison-control counts do not separate licensed products from illicit or unregulated hemp-derived products. [10] That limitation is real and is labeled below.
Youth: what happened after Prop 64
The right test is not a slogan about 'protecting children.' It is whether adolescent use rose, whether younger children were more often poisoned, and whether other youth harms (emergency visits, cannabis use disorder, psychosis risk, arrests) moved in the data. Each is taken in turn. Pre/post comparisons are not automatic proof of cause. COVID-19 closed schools and changed youth social life in 2020 and 2021, which cuts against reading every later drop as a legalization success.
Teen use on California school surveys
The California Healthy Kids Survey (CHKS), conducted by WestEd for the California Department of Education, is the state's representative biennial survey of 7th, 9th, and 11th graders. Past-30-day marijuana use: [11]
| Grade | 2015-17 | 2017-19 | 2019-21 |
|---|---|---|---|
| 7th | 2% | 4% | 2% |
| 9th | 9% | 10% | 6% |
| 11th | 17% | 16% | 12% |
Use had already been falling before the 2016 vote. The 2017-19 results, the first full biennial window after the vote and during the start of retail sales, were mostly flat: 9th and 11th grade current use held near 10% and 16%, and 7th grade ticked up slightly. WestEd warned that the 2017-19 questions were reworded to cover smoking, vaping, eating, or drinking marijuana, which complicates a strict two-year comparison. [11] Current use then dropped in 2019-21. WestEd said that drop 'likely was due to COVID-19 pandemic conditions,' and single-year figures show a steeper decline in 2020-21 (11th grade current use from 14% in 2019-20 to 9% in 2020-21). [11] The 19th Biennial State CHKS (2021-23) is listed as 'coming soon' and is Pending as a statewide series. [11]
The California Youth Tobacco Survey (CYTS), previously the California Student Tobacco Survey, is CDPH's school survey of 8th, 10th, and 12th graders. In 2022, 8.8% of high school respondents (10th and 12th grade) reported past-30-day marijuana use, and 21.4% reported ever use. [16] In 2023, current use was 10.4% and ever use was 23.0%. Among 8th graders in 2023, current use was 3.1% and ever use was 8.5%. [16] The 2022 to 2023 uptick is a post-pandemic rebound, not a return to the mid-2010s 11th-grade CHKS levels. Among current high school users who said they bought their own marijuana, 38.3% got it from a store or dispensary, and 44.9% got it from someone else. [16] Licensed shops are not supposed to sell to minors. That share is a leak in the age gate, not proof that most teen cannabis comes from legal counters.
Finding on school-survey use: Substantiated that current teen use did not surge after legalization. The 2019-21 decline should not be credited to Prop 64, because it coincided with COVID-19. The 2021-23 statewide CHKS series is Pending. Youth access through stores is Partly substantiated as a compliance problem, not as the dominant source.
Household and national comparison surveys
SAMHSA's National Survey on Drug Use and Health (NSDUH) provides model-based California estimates. Past-month marijuana use among Californians ages 12 to 17 was 8.32% in 2014-15, 6.93% in 2016-17, and 6.15% in 2022-23. Past-year use in that age group was 14.11%, 13.30%, and 11.21% in the same periods. [17] Among young adults 18 to 25, past-month use rose from 20.52% in 2014-15 to 24.07% in 2016-17 and 28.25% in 2022-23. [17] Two caveats: later NSDUH estimates include marijuana vaping, so they are not a perfect apples-to-apples series, and a mid-period 2018-19 official table was not independently re-opened this run. The direction is still clear enough to report: adolescent past-month use is not higher than it was just before the vote; young-adult use is higher.
CDC Youth Online reports California YRBS current marijuana use (past 30 days) among high school students at 17.1% in 2019. [18] Other California YRBS years were not independently confirmed from a fetched table this run and are left Unverified. Anderson, Rees, Sabia, and Safford (JAMA Network Open, 2021, corrected 2022) used weighted national and state YRBS data for 1993-2019 and found no statistically significant association between recreational or medical marijuana laws and current or frequent high school marijuana use (fully adjusted national YRBS odds ratio for recreational laws and current use: 1.01; 95% CI, 0.85 to 1.19). [18] An earlier 2019 JAMA Pediatrics estimate from some of the same authors, which had reported a decrease, was challenged for pooling and weighting issues and should not be used. The 2021/2022 paper itself was retracted and replaced to fix analysis errors; the replacement is the version cited here. One coauthor reported grant support from the Charles Koch Foundation. [18] The result is still the best large YRBS difference-in-differences estimate fetched this run, and it does not show a teen-use surge. It runs only through 2019 and covers 10 states with pre/post recreational-law data, a real limit.
Child exposures, emergency visits, and potency
This is the clearest youth harm in the official record. The California State Auditor, citing the California Poison Control System, reported that calls related to cannabis ingestion among children 5 and younger rose 469%, from 148 in 2016 to 842 in 2023. Calls among ages 6 to 19 rose 147%, from 256 in 2016 to 633 in 2023. [10] A CDPH poison-control infographic, using a slightly different under-6 cut, reported calls among children under 6 rising from 330 in 2018 to 791 in 2021 (up 140%), and said 501 of those 2021 calls (63%) involved edibles. [15] The Auditor also reported 2023 California emergency department visits for cannabis overdose of 308 among children younger than 5, 99 among ages 5 to 9, and 328 among ages 10 to 14. [10]
Strongest counter: DCC, in its audit response, said these statistics do not distinguish licensed, tested products from illicit or unregulated hemp-derived products, and that less than half the state has legal retail access while illicit products are available everywhere. [10] That is a fair limit. It does not erase the rise in poisonings. It means the share caused by licensed packaging, versus illicit look-alike edibles and household storage, is Contested.
Potency rose long before Prop 64 and has stayed high in the legal market. The Auditor, citing a 2024 study of legal California cannabis, reported that most flower and flower products sold by legal retailers test at 20% THC or greater, five to 10 times the levels found in national cannabis studied in the 1970s and 1980s. [10] DCC told the Auditor it is not required to monitor the gradual rise of THC concentration and is funding university research instead. [10] Concentrates can be far higher than flower. High potency is a background risk for accidental child ingestion and for problem use among heavy users. A causal link from Prop 64 itself to the long-run potency trend is not established, because potency was already rising under prohibition and the medical market.
Cannabis use disorder, hyperemesis, and psychosis
Survey use and diagnosed harm can move in different directions. Padon and colleagues (Addiction), using Kaiser Permanente Northern California electronic health records for adolescents 13 to 17, found that incident cannabis use disorder rates were declining before the 2016 vote, then increased after passage with a six-month lag (annualized adjusted rate ratio 1.26; 95% CI, 1.14 to 1.38). At the 2018 start of retail sales the slope change was negative (0.86; 95% CI, 0.76 to 0.98), but incidence remained elevated through three years after passage. [19] Limits: this is one health system, not a statewide census; a diagnosis is not the same as a survey report; more clinical recognition after legalization could explain part of the rise. The finding is still the strongest California-specific evidence fetched this run that problem use among adolescents may have increased even if average survey use did not. Finding: Partly substantiated, Contested as to cause.
A Northern California electronic-health-record study of suspected cannabinoid hyperemesis syndrome found emergency visits rising from 2009 to 2019, with prevalence peaking in 2017, then a slight decline through 2019. [22] The rise began before adult-use sales and overlaps a long medical-cannabis period, so it is not a clean Prop 64 effect. Finding: a real clinical trend, cause Contested.
On psychosis, Elser and colleagues (JAMA Network Open, 2023) studied commercial and Medicare Advantage claims from 2003 to 2017 and found no statistically significant increase in psychosis-related diagnoses or antipsychotic prescriptions associated with state medical or recreational legalization. [23] Limits: the data end in 2017, before California retail sales began in January 2018, and the sample is insured, not a full population. Exploratory subgroup signals were reported and were not the main result. A California-only causal estimate for psychosis after retail sales was not fetched this run (Unverified at the state causal level). The general research literature has long associated heavy, high-potency cannabis use with higher psychosis risk in vulnerable people; that is not the same as proving that Prop 64 increased statewide psychosis incidence.
Youth arrests and juvenile records
Prop 64 cut the penalty for a person under 18 who possesses 28.5 grams or less to an infraction, with drug education or counseling and community service (four hours of education or counseling and up to 10 hours of community service on a first offense; six hours and up to 20 hours after that). [25] Health and Safety Code section 11361.5 generally requires destruction of records for listed juvenile marijuana offenses two years after conviction, or after arrest if there was no conviction, with a longer hold when the offense was on K-12 grounds, until the person turns 18. [26]
Crime in California 2023 (DOJ OpenJustice) reports felony marijuana arrests of 1,617 in 2018 and 504 in 2023. Juvenile felony marijuana arrests fell from 128 in 2018 to 19 in 2023, an 85.2% drop. Adult felony marijuana arrests fell from 1,489 to 485, a 67.4% drop. [14] In 2023 there were also 1,972 misdemeanor marijuana arrests, of which 279 were of people ages 10 to 17. [14] DOJ itself warns that some misdemeanor marijuana statutes were reclassified as infractions, so later arrest counts are not a pure behavioral series. [14] The direction is still a large decline in youth criminal caseload for marijuana, which was an intended effect of the measure. Finding: Substantiated as a caseload result. Not proof that youth use fell because fewer youth were arrested.
DUI and impaired driving
Prop 64 earmarked money to the California Highway Patrol for impaired-driving work, including protocols and grants, and the Legislature later charged CHP with convening an Impaired Driving Task Force under Vehicle Code section 2429.7 (SB 94, 2017). [20] The Task Force's report to the Legislature recommended against a per se THC limit: 'A per se limit for drugs, other than ethanol, should not be enacted at this time as current scientific research does not support it.' [20] That conclusion matters, because a lot of public argument treats any THC-positive test as proof of a stoned driver.
Measurement limits, which should be stated before any trend: THC can remain detectable after acute impairment has faded. Testing rates and toxicology panels have changed over time, so a rising share of 'THC-positive' fatal-crash drivers can reflect more testing rather than more impairment. California has no per se THC standard. Alcohol remains a major, better-measured impaired-driving risk. The Task Force also found that existing DUID data were not standardized enough to clearly track trends. [20]
The strongest comparative crash study fetched this run is Farmer, Monfort, and Woods (Journal of Studies on Alcohol and Drugs, 2022), from the Insurance Institute for Highway Safety. They modeled quarterly injury and fatal crash rates per mile of travel in 2009 to 2019, with controls for unemployment, speed limits, seat-belt use, alcohol use, and rural mileage. Legalization of recreational use was associated with a 6.5% increase in injury crash rates and a 2.3% increase in fatal crash rates; the later start of retail sales did not add a substantial further change. The combined effect of legalization and retail sales was a 5.8% increase in injury crash rates and a 4.1% increase in fatal crash rates. Effects varied widely by state, from a 7% decrease to an 18% increase for injury crashes, and from a 10% decrease to a 4% increase for fatal crashes. California was one of the five legalizing states in the analysis (with Colorado, Washington, Oregon, and Nevada), compared with other Western states that had not legalized. [21] The authors called this an early look and said researchers should keep monitoring the data.
Finding: Contested, not a proven general fact that 'Prop 64 caused a California DUI wave,' and not a clearance that traffic risk is unchanged. The IIHS study is a real comparison-group result and points to a modest average increase in crash rates after legalization. It is not a count of cannabis-impaired crashes, and the state-by-state range includes decreases. THC-positive fatality shares, standing alone, are not a reliable impairment trend.
Who benefited from its passing
Campaign funders
The Yes side outspent the No side by about 14 to 1 ($22.85 million to $1.61 million, Secretary of State, through December 31, 2016). [12] The people and entities who put up that money are the first, and most direct, beneficiaries of a successful campaign. They include a mix of legalization donors, a 501(c)(4) long associated in news reporting with George Soros, and at least one company, Weedmaps, with a commercial stake in a legal retail market. [2,12,13] Named public supporters included Gavin Newsom and Barbara Lee. [3] That is not the same as a documented personal financial windfall, and no such claim is made here.
The licensed industry, and the illicit one that remains
Licensed producers, retailers, testing labs, and related vendors gained a legal market. That market is smaller than promised on the illicit-displacement test: about 1.4 million licensed pounds versus about 11.4 million illicit pounds a year. [6] High taxes, fees, and local bans are the documented reasons legal product often cannot compete on price. [6,7] An official statewide count of multi-state operators' market share was not fetched this run (Unverified). Local governments that tax and license retail in the 46% of jurisdictions that allow some commercial activity also benefit, as do the state programs that receive dedicated cannabis tax revenue. [4,7] The majority of cities and counties that ban retail did not become storefront hosts.
Equity programs
Social-equity licensing was sold as a way to repair harm from past enforcement. Official outcomes are mixed and incomplete. DCC's FY 2023-24 annual report recorded 764 fee waivers and 572 fee deferrals, with $3.77 million spent on waivers. [27] The California State Auditor has separately found weak oversight and some inappropriate spending in local cannabis grant programs that were supposed to help businesses transition. [28] A single official score of how many equity licensees are still operating, profitable, and not fronted by outside capital was not fetched this run (Unverified). Finding: Partly substantiated as a spending and waiver program; not substantiated as a proven repair of past enforcement harm.
People with old convictions, and racial patterns in remaining arrests
This is the largest documented human benefit besides the legal adult market itself. DOJ identified 227,650 potentially eligible past convictions in July 2019. As of October 2, 2023, 213,444 cases had been recalled, dismissed, sealed, or redesignated, and 14,206 remained potentially eligible, a 94% reduction. Those cases involved 167,389 people who received relief, of 180,835 people originally identified. Some counties still lagged (Imperial, Orange, and San Joaquin were among the larger remaining pools). [24] Relief is not the same as a job, housing, or licensing outcome. Those downstream effects were not measured in the DOJ report.
Remaining arrests are much smaller, but racial disproportionality did not disappear. In 2023, Black people accounted for 123 of 504 felony marijuana arrests (24.4%) and 344 of 1,972 misdemeanor marijuana arrests (17.4%). [14] Black people alone are 6.4% of California's population (U.S. Census Bureau QuickFacts). [29] Hispanic people accounted for 44.0% of felony and 46.1% of misdemeanor marijuana arrests, compared with 41.2% of the population. [14,29] Raw arrest shares are not proof of present-day bias in every case, and the totals are now small. They do show that the remaining enforcement footprint is still uneven.
Tax revenue, for cross-reference only
CDTFA reported more than $6.7 billion in cannabis taxes since January 2018, including $3.5 billion in excise tax. [4] Most of that money is dedicated to youth programs, environmental cleanup, and law enforcement, as the measure promised. [2] The question asked here is what else, besides taxes, has redeeming value. Taxes are real. They are not the whole ledger.
Redeeming value besides taxes
Yes. Several non-tax benefits are real. None of them erases the child-poisoning rise, the illicit market, or the unfinished equity record.
Criminal justice
Marijuana arrest volume collapsed, including for juveniles, and more than 167,000 people have had eligible old convictions recalled, dismissed, sealed, or redesignated. [14,24] That is a concrete reduction in criminal-system contact for conduct that is now legal for adults. Strongest counter: some of the arrest drop is mechanical reclassification to infractions, not a change in behavior; dollar savings were never independently audited (Unverified); racial disproportionality remains in the much smaller remaining arrest stream. [14,29]
Product testing and a legal adult channel
Licensed products must be tested for potency, pesticides, and contaminants before sale. Adults 21 and over in jurisdictions with stores can buy a labeled product instead of an untested illicit one. Strongest counter: the illicit market is still much larger, so most California cannabis is still untested. [6] Lab failures and recalls show that the testing system is not airtight. Packaging rules have not prevented a large rise in child exposures. [10] A legal channel is a benefit for the customers who use it. It is not yet a statewide safety system.
Medical access
California already legalized medical cannabis in 1996 (Prop 215). Prop 64 did not create medical access. It folded medical and adult-use into a later dual licensing system and kept a medical track. Any claim that Prop 64 'gave patients medicine they could not get before' is Overstated. Some patients may benefit from a more standardized, tested market. That incremental effect is Unverified as a measured access gain.
Opioid substitution
An early and widely cited claim was that medical cannabis laws reduce opioid overdose deaths. Bachhuber and colleagues (JAMA Internal Medicine, 2014) estimated a 24.8% lower opioid-overdose mortality in states with medical cannabis laws, using 1999 to 2010 data. [30] Shover, Davis, Cohen, and Humphreys (PNAS, 2019) extended that analysis through 2017 and found the association reversed: from an estimated 21% lower mortality to about 23% higher mortality. They concluded the relationship was likely spurious and that aggregate ecological data cannot establish a causal, individual-level effect. [30] Finding: the opioid-substitution argument is Not substantiated as a Prop 64 benefit. The strongest counter to the original claim is the Shover reversal itself.
Jobs
Licensed cultivators, manufacturers, retailers, distributors, and labs clearly employ people. EDD collects payroll taxes from licensed cannabis employers but, in the sources fetched this run, does not publish a single official statewide cannabis job count (Unverified as to an official headcount). Industry-funded job estimates exist and should be labeled as such if used; no such estimate is treated here as an official figure. The ERA/DCC market report documents price pressure and a difficult licensed market, which is not the profile of a booming, stable employer of last resort. [6] Finding: some legal-industry employment is real; the size and durability of that job benefit are Unverified in official data fetched this run.
What a good policy would include
- Keep the combined state and local tax and fee load low enough that legal product can compete on price. A scored 'break-even versus illicit' rate is Unverified. [6]
- Pair legalization with funded enforcement against unlicensed grows and unregulated hemp-derived look-alike edibles, which DCC says are part of the child-exposure problem. Incremental effect of current enforcement spending: Unverified. [6,10]
- Shrink the local-ban patchwork, or score a default-allow rule with a local opt-out. As of July 2024, 57% of 539 cities and counties still barred retail. [7]
- Publish an official statewide audit of criminal-justice savings and remaining marijuana caseloads, so the 'tens of millions' promise can be tested in dollars, not only in arrest counts. [2,14]
- Tighten child protections where the Auditor found gaps: define packaging elements that are attractive to children, consider pre-market packaging review or plain packaging (Oregon's model), require usable serving-size measures on multi-serving beverages, and escalate penalties for repeat violators. Inspection coverage below half of licensees is not adequate if child exposures are rising. [10]
- Close the youth retail leak. CYTS 2023 found that 38.3% of current high school users who bought marijuana got it from a store or dispensary. That needs measured ID-enforcement results, not a policy memo. [16]
- Do not enact a THC per se DUI limit that the CHP Task Force said the science does not support. Do standardize DUID arrest, toxicology, and crash data so California can tell impairment trends from testing-rate trends. [20]
- Score equity programs on surviving, independent businesses, not only on fee waivers issued. [27,28]
Who supports / who opposes
Named public supporters, from the 2016 voter debate, included then-Lt. Gov. Gavin Newsom and Rep. Barbara Lee, plus state ACLU and NAACP branches. [3] The Yes campaign raised $22,849,274 through December 31, 2016. Largest committee totals: New Approach PAC, $7,444,000; the main Yes on 64 committee, $6,881,245; and Fund for Policy Reform, a 501(c)(4), $6,140,000. [12] Largest listed gifts include Sean Parker and affiliated entities and Weedmaps (Ghost Management Group, LLC). [2,12] News reporting has associated Fund for Policy Reform with George Soros; that is a secondary attribution, not a line in the official totals. [13]
Named public opponents included Sen. Dianne Feinstein, the California Republican and Libertarian parties, and the California District Attorneys Association. [3] The largest No committee was SAM Action, at $1,364,000, with Julie Schauer as the biggest listed individual donor. Law enforcement groups including PORAC, the California Association of Highway Patrolmen, and the California Teamsters public affairs council also gave. [2,12]
4. Good or bad for society
The strongest case for
Billions in new, dedicated revenue. [4] A regulated, tested product for adults 21 and over, at least inside the licensed channel. [2,6] A large, documented drop in marijuana arrest volume, including juvenile felony marijuana arrests. [14] Automatic or court-ordered relief on 213,444 old convictions, covering 167,389 people, as of October 2, 2023. [24] Official school surveys do not show a post-legalization surge in teen use. [11,16,17,18]
The strongest case against
The illicit market still dwarfs the legal one, about eight to one on production. [6] Revenue sits at the low end of the forecast, and the tax structure had to be rebuilt. [4,5] Most local governments still block retail. [7] Child poison-control calls and emergency visits rose sharply, and the Auditor found weak packaging enforcement. [10] A Northern California health-system study found incident cannabis use disorder among adolescents rose after the vote, even though survey use did not clearly increase. [19] Crash-rate studies of legalizing states, including California, find a modest average increase in injury and fatal crash rates, with wide variation by state and serious measurement limits. [21]
Fiscal and integrity notes (waste, fraud, abuse)
The main integrity issue remains a persistent illegal supply chain of about 11.4 million pounds a year that pays no tax. [6] Local option, written into the measure, is the legal reason most jurisdictions have no storefront, not a hidden loophole. [7] Licensed-market integrity is mixed: products must be lab-tested, but DCC has revoked or suspended laboratory licenses over improper testing, and recalls have been substantial. Exact official recall totals vary by period and were not all independently re-tallied from DCC's raw recall log this run (partly Unverified as to a single all-years count). The Auditor's 2024-105 report documents inadequate inspection coverage and weak follow-through on packaging that may attract children. [10] No finding of a comprehensive licensed-market fraud count was fetched this run (Unverified).
Direct verdict
MIXED. Unchanged. Legalization, tax revenue, a large drop in marijuana arrests, and record relief delivered. The promise to displace the illicit market did not. Teen survey use did not clearly rise. Child poisonings and emergency visits did. Impaired-driving risk is not settled. The social ledger is not 'taxes plus no downside,' and it is not 'a net loss for kids and drivers, full stop.'
Gaps / unverified
- Net criminal-justice dollar savings: Unverified (no official post-enactment audit fetched).
- Licensed-market fraud or diversion counts, and a single official all-years recall total: Unverified or only partly tallied.
- A scored tax rate at which legal product consistently beats illicit prices: Unverified.
- Statewide CHKS 2021-23 teen marijuana rates: Pending ('coming soon').
- California YRBS current-use rates for years other than 2019: Unverified this run.
- Official statewide cannabis job count: Unverified.
- MSO market-share and equity-license survival rates: Unverified.
- Causal share of child poisonings attributable to licensed versus illicit or hemp-derived products: Contested.
- Statewide causal estimate of psychosis incidence after 2018 retail sales: Unverified.
- Named supporters and opponents are limited to those in the cited sources; fuller endorsement lists are on the Ballotpedia page. [1]
References
Sources numbered and fetched or re-checked November 12, 2026 (America/Los_Angeles).
[1] Ballotpedia, California Proposition 64, Marijuana Legalization (2016): results 57.13% Yes. https://ballotpedia.org/California_Proposition_64,_Marijuana_Legalization_(2016)
[2] California Secretary of State, Quick Guide to Props, Prop 64: summary, fiscal impact, and largest contributions. https://quickguidetoprops.sos.ca.gov/propositions/2016-11-08/64
[3] KALW, Election Briefs: Prop 64, October 26, 2016: named supporters and opponents. https://www.kalw.org/show/crosscurrents/2016-10-26/election-briefs-prop-64-legalization-of-marijuana
[4] CDTFA News Release 25-02, March 5, 2025: Q4 2024 cannabis tax revenue; totals since 2018; cultivation tax elimination; vendor compensation. https://cdtfa.ca.gov/news/25-02.htm
[5] LAO EconTax Blog, Cannabis Tax Revenue Update (2024 Q3), December 3, 2024. https://www.lao.ca.gov/LAOEconTax/Article/Detail/817
[6] ERA Economics for Department of Cannabis Control, California Cannabis Market 2024 Report, Executive Summary, March 2025. https://cdn.cannabis.ca.gov/wp-content/uploads/sites/2/2025/03/California-Cannabis-Market-Outlook-Executive-Summary-FNL.pdf
[7] Department of Cannabis Control, Condition and Health of the Cannabis Industry in California, data as of July 2024 (Assembly Budget presentation, March 2025). https://abp.assembly.ca.gov/system/files/2025-03/3-dcc-report-on-the-condition-and-health-of-the-cannabis-industry_0.pdf
[8] CA NORML, July 9, 2018, compiling the California Attorney General's Crime in California 2017 report: 6,065 marijuana arrests in 2017 vs 13,810 in 2016. Used only as a pre-2018 compiled baseline; later official tables in [14] are the post-2018 series. https://www.canorml.org/marijuana-arrests-in-ca-drop-56-following-passage-of-prop-64-felony-arrests-drop-74/
[9] Department of Cannabis Control, Annual Legislative Report, Fiscal Year 2024-25 (posted February 2026). https://cdn.cannabis.ca.gov/wp-content/uploads/sites/2/2026/02/Annual-Legislative-Report-FY24-25.pdf
[10] California State Auditor, Report 2024-105, Department of Cannabis Control, August 7, 2025: poison-control calls 148 (2016) to 842 (2023) among children 5 and younger; 256 to 633 among ages 6 to 19; 2023 ED visits 308 (under 5), 99 (ages 5-9), 328 (ages 10-14); packaging and inspection findings; potency and DCC response. https://www.auditor.ca.gov/reports/2024-105/
[11] WestEd / California Healthy Kids Survey: 2015-17 Biennial State CHKS (current use 2%, 9%, 17% by grade); Marijuana Use Among California Secondary Students, 2017/19; Factsheet 24, Trends in Alcohol, Tobacco, and Other Drug Use, 2019/21 (including the COVID caveat and the 2019-20 vs 2020-21 split); CalSCHLS report repository noting the 2021-23 statewide report as coming soon. https://data.calschls.org/resources/Biennial_State_1517.pdf ; https://calschls.org/docs/marijuana_use_vol_1.pdf ; https://calschls.org/docs/factsheet-24_atod_trends.pdf ; https://calschls.org/docs/marijuana_2024.pdf ; https://calschls.org/reports-data/legacy/
[12] California Secretary of State, 2016 ballot measure contribution totals, Proposition 64, updated February 7, 2017, totals through December 31, 2016: $22,849,274 in support, $1,611,469 in opposition, with committee totals. https://www.sos.ca.gov/campaign-lobbying/helpful-resources/measure-contributions/2016-ballot-measure-contribution-totals/marijuana-legalization-initiative-statute
[13] Los Angeles Times, November 2, 2016, reporting on major Prop 64 donors, including Fund for Policy Reform's association with George Soros. Secondary news attribution, not a substitute for the official SOS totals in [2] and [12]. https://www.latimes.com/politics/la-pol-ca-proposition64-cash-snap-20161102-story.html
[14] California Department of Justice, Crime in California 2023, Tables 21 and related arrest tables: felony marijuana arrests 1,617 (2018) to 504 (2023); juvenile felony marijuana 128 to 19; 2023 race and age breaks, including 1,972 misdemeanor marijuana arrests and 279 arrests of people ages 10 to 17; caution on infraction reclassification. https://data-openjustice.doj.ca.gov/sites/default/files/2024-07/Crime%20In%20CA%202023f.pdf
[15] California Department of Public Health, cannabis poison-control infographic: calls among children under 6 from 330 (2018) to 791 (2021); 501 (63%) of 2021 under-6 calls involved edibles. https://www.cdph.ca.gov/Programs/CCDPHP/sapb/CDPH%20Document%20Library/cannabis-poison-control-infographic.pdf
[16] CDPH / RTI, Results of the 2022 California Youth Tobacco Survey, March 2023: 8.8% current and 21.4% ever high school marijuana use. Results of the 2023 California Youth Tobacco Survey, March 2024: 10.4% current and 23.0% ever high school use; 3.1% current and 8.5% ever among 8th graders; 38.3% of current users who bought marijuana obtained it from a store or dispensary. https://www.cdph.ca.gov/Programs/CCDPHP/DCDIC/CTCB/CDPH%20Document%20Library/ResearchandEvaluation/FactsandFigures/CYTS2022AnnualReportFinal.pdf ; https://www.cdph.ca.gov/Programs/CCDPHP/DCDIC/CTCB/CDPH%20Document%20Library/ResearchandEvaluation/SurveyInstrumentsTrainingManualsAndProtocols/CYTS2023AnnualReport_FINAL.pdf
[17] SAMHSA, NSDUH state small-area estimates for California: 2014-15 (past-month marijuana use 8.32% ages 12-17 and 20.52% ages 18-25; past-year 14.11% ages 12-17); 2016-17 (6.93% and 24.07% past-month; 13.30% past-year ages 12-17); 2022-23 (6.15% and 28.25% past-month; 11.21% past-year ages 12-17). Later estimates include marijuana vaping. https://www.samhsa.gov/data/sites/default/files/NSDUHsaeStateTabs2015B/NSDUHsaeCalifornia2015.pdf ; https://www.samhsa.gov/data/sites/default/files/cbhsq-reports/NSDUHsaeSpecificStates2017B/NSDUHsaeCalifornia2017.pdf ; https://www.samhsa.gov/data/sites/default/files/reports/rpt56188/2023-nsduh-sae-state-tables_0/2023-nsduh-sae-state-tabs-california.pdf
[18] CDC Youth Online, California 2019 YRBS: 17.1% of high school students reported current (past 30-day) marijuana use. https://nccd.cdc.gov/youthonline/app/Results.aspx?LID=CA . Anderson DM, Rees DI, Sabia JJ, Safford S. Association of Marijuana Legalization With Marijuana Use Among US High School Students, 1993-2019. JAMA Network Open. 2021;4(9):e2124638, retracted and replaced March 8, 2022; corrected fully adjusted national YRBS OR 1.01 (95% CI, 0.85-1.19) for recreational laws and current use. One coauthor reported Charles Koch Foundation support. https://jamanetwork.com/journals/jamanetworkopen/fullarticle/2783850
[19] Padon AA, et al. Adolescent cannabis use disorder following recreational cannabis legalization in California, USA: a population-based interrupted time series study. Addiction. Kaiser Permanente Northern California adolescents 13-17; post-passage adjusted rate ratio 1.26 (95% CI, 1.14-1.38) with a six-month lag. https://onlinelibrary.wiley.com/doi/full/10.1111/add.70597
[20] California Highway Patrol, Impaired Driving Task Force, Report to the Legislature (SB 94 / Vehicle Code 2429.7): recommends against a per se drug limit other than ethanol; notes data and testing limits; describes Prop 64 funding for CHP impaired-driving work. https://www.chp.ca.gov/siteassets/files/senate_bill_94.pdf
[21] Farmer CM, Monfort SS, Woods AN. Changes in Traffic Crash Rates After Legalization of Marijuana: Results by Crash Severity. Journal of Studies on Alcohol and Drugs. 2022;83(4):494-501. IIHS authors. Combined legalization and retail-sales effect: +5.8% injury crash rates, +4.1% fatal crash rates, 2009-2019, with wide state variation. PubMed: https://pubmed.ncbi.nlm.nih.gov/35838426/ . IIHS bibliography: https://www.iihs.org/research-areas/bibliography/ref/2229
[22] Prevalence and Trends of Suspected Cannabinoid Hyperemesis Syndrome Over an 11-Year Period in Northern California: An Electronic Health Record Study. PMC11404979. Rising visits 2009 to 2019, peak in 2017. https://pmc.ncbi.nlm.nih.gov/articles/PMC11404979/
[23] Elser H, et al. State Cannabis Legalization and Psychosis-Related Health Care Utilization. JAMA Network Open. 2023;6(1):e2252689. No statistically significant increase in psychosis diagnoses or antipsychotic prescriptions associated with medical or recreational legalization in 2003-2017 claims data. https://jamanetwork.com/journals/jamanetworkopen/fullarticle/2800728
[24] California Department of Justice, AB 1706 Legislative Report, December 1, 2023 (data as of October 2, 2023): 227,650 potentially eligible convictions in July 2019; 213,444 cases granted relief; 14,206 remaining; 167,389 subjects granted relief of 180,835 identified. https://oag.ca.gov/system/files/media/ab1706-q4-report.pdf
[25] California Health and Safety Code section 11357: under-18 possession of 28.5 grams or less is an infraction, with specified education or counseling and community service. https://leginfo.legislature.ca.gov/faces/codes_displaySection.xhtml?lawCode=HSC§ionNum=11357
[26] California Health and Safety Code section 11361.5: destruction of specified juvenile marijuana records. https://leginfo.legislature.ca.gov/faces/codes_displaySection.xhtml?lawCode=HSC§ionNum=11361.5.
[27] Department of Cannabis Control, Annual Report, Fiscal Year 2023-24: 764 fee waivers, 572 fee deferrals, $3.77 million spent on waivers. https://cdn.cannabis.ca.gov/wp-content/uploads/sites/2/2025/03/DCC-Annual-Report_Fiscal-Year-2023_24.pdf
[28] California State Auditor, Report 2024-048, Cannabis Business Licensing / Local Jurisdiction Assistance Grant Program, February 2025: progress plus inappropriate expenditures and oversight gaps. https://www.auditor.ca.gov/wp-content/uploads/2025/02/2024-048-Report.pdf
[29] U.S. Census Bureau, QuickFacts, California: Black alone 6.4%; Hispanic or Latino 41.2%. https://www.census.gov/quickfacts/fact/table/CA/RHI225224
[30] Shover CL, Davis CS, Cohen SC, Humphreys K. Association between medical cannabis laws and opioid overdose mortality has reversed over time. PNAS. 2019;116(26):12624-12626. Reversal of the earlier Bachhuber et al. 2014 JAMA Internal Medicine association (24.8% lower opioid-overdose mortality, 1999-2010) to about 23% higher when extended through 2017; authors conclude the relationship is likely spurious. https://www.pnas.org/doi/10.1073/pnas.1903434116
PolicyBombs. Follow @PolicyBombs on X.
Accountability Scorecard
MixedPolicy #90 grade: Mixed. MIXED. Legalization, tax revenue, a large drop in marijuana arrests, and record relief delivered. The promise to displace the illicit market did not. Teen survey use did not clearly rise. Child poisonings and emergency visits did.
Measured outcome: Poison-control calls among children 5 and younger rose from 148 in 2016 to 842 in 2023, a 469% increase (State Auditor 2024-105, citing California Poison Control). Teen survey use did not clearly rise (WestEd CHKS). By October 2, 2023, 213,444 of 227,650 eligible convictions had been cleared or reduced, covering 167,389 people (DOJ AB 1706 report). Illicit production still outpaces licensed production about eight to one (ERA/DCC 2024).
Positions on record
- For: Gavin Newsom (then-Lt. Gov.), public supporter [3]
- For: Rep. Barbara Lee, public supporter [3]
- For: New Approach PAC, $7,444,000 in support [12]
- For: Yes on 64 committee, $6,881,245 [12]
- For: Fund for Policy Reform, $6,140,000 [12]. News reporting has associated the 501(c)(4) with George Soros [13]
- For: Sean Parker and affiliated entities, largest listed gifts [2]
- For: Ghost Management Group, LLC dba Weedmaps, $1,000,000 listed gift [2] [12]
- Against: Sen. Dianne Feinstein, public opponent [3]
- Against: California Republican Party and California Libertarian Party [3]
- Against: California District Attorneys Association [3]
- Against: SAM Action, $1,364,000 [12]
- Against: Julie Schauer, largest listed individual No donor [2]
- Against: PORAC, California Association of Highway Patrolmen, and California Teamsters public affairs council, listed gifts [2]
How we grade
Grades come from the "good or bad for society" verdict (question 4) in each PolicyBomb research pack and rest on measured outcomes, not motives. Harmful means the research found net harm, Mixed means real benefits and real costs, Helpful means net benefit. Every name is tied to a documented action (an authored bill, a signature, a recorded vote, a filed donation, an order or a public statement) with a linked source. Only full scorecard rows count toward a person's Harmful, Mixed and Helpful tally; positions listed from the research are shown with their source but are not tallied yet.
Grade basis: 2016-01-ca-prop-64-marijuana-legalization-full-rev2-2026-11-12 (Day 90), verdict.