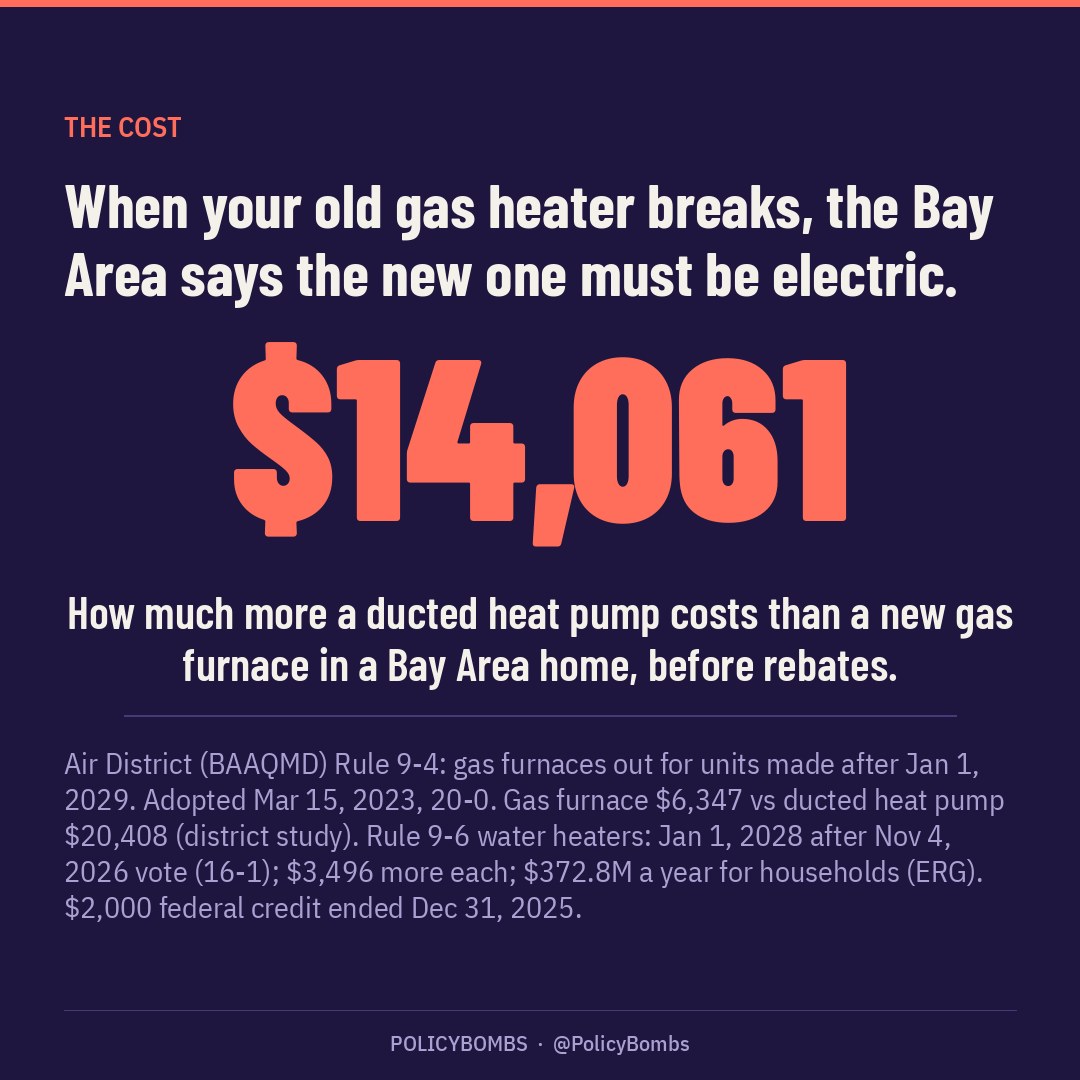
$14,061. That's how much more a ducted heat pump costs than a new gas furnace in a Bay Area home, before rebates. $20,408 vs. $6,347. That's the Air District's own study.
Here's the deal. When your furnace dies after Jan 1, 2029, the new one has to be zero-emission. In practice: electric. Your water heater hits the same wall Jan 1, 2028. Nobody makes you rip out a working unit. You just pay when it breaks.
Adopted Mar 15, 2023 on a 20-0 vote. On Nov 4, 2026 the board voted 16-1 to delay the water heater part a year and add exemptions. One supervisor walked out because repeal wasn't even on the menu.
The water heater math: $3,496 more per heat pump. $372.8M a year for Bay Area households, per the district's own consultant. Bill savings? About $50 a year, and that number traces back to a 2019 analysis.
And the rebates the district counted? The $2,000 federal tax credit died Dec 31, 2025. The up-to-$8,000 federal rebate for lower-income homes? Fully reserved since Feb 24, 2026.
Then there's the power bill. PG&E's average home rate was 40.6 cents per kWh in March 2026. The U.S. average in Aug 2026: 18.16 cents. The district's own cost study found most homes on PG&E's standard plan saw no bill savings after switching.
When the power goes out, the heat pump stops. To be fair, so does a gas furnace: it needs power for the fan. In 2024, PG&E's North Bay customers averaged about 12 hours without power. San Francisco: under 2 hours.
The statewide grid? No Flex Alerts since 2022. The real squeeze is your panel and your street's wiring, and you pay for those.
Quality: heat pumps work fine in our mild climate and add AC. Old ducts, tiny closets and 100-amp panels are where costs explode.
What does "clean air" buy here? The target is NOx, which helps form smog and fine particles. Staff project 3,236 fewer tons a year once every old unit is replaced, around 2046. That's about 4.6% of the Bay Area's 2018 NOx. The 2026 exemptions could shave off up to about 288 tons.
The district's own model: about 1.6% less fine-particle pollution where people live, and "no significant change in ozone."
The "15,000 asthma attacks" the district cites? Its own table calls them asthma symptoms and inhaler uses, valued at about $5,900 a year in total. The "85 deaths" is the top of a modeled range for wiping out every targeted gas heater in homes and businesses.
Verdict: MIXED, leaning BAD for families. The clean-air gain is real, but small and slow. The bill lands on homeowners and renters, on power rates more than double the national average, while the furnace math still counts money that's gone.
Numbering note: this is Policy #76 on the PolicyBombs backlog (Day 76).
Full analysis
VERDICT: MIXED, leaning BAD for family budgets as written. The clean-air gain is real but modest and slow: about 3,236 tons of NOx a year by 2046 on staff projections (roughly 2,950 after the 2026 exemptions), about 4 to 5 percent of 2018 Bay Area NOx, which the district's model turns into about 1.6 percent less fine-particle pollution where people live and no significant change in ozone. The "only when it breaks" design is smarter than a rip-out mandate. But the Air District's own numbers show the water-heater rule costs households far more each year than the health value staff assign to it, the furnace rule (the expensive part) has not been re-costed since the federal money it counted disappeared, and the exemptions that make the water-heater rule tolerable also cut its pollution benefit roughly in half. New in this revision: PG&E power costs about 40.6 cents per kWh, more than double the U.S. average, which leaves heat pump water heaters cheaper to run but makes heat pump furnaces a toss-up that depends on the rate plan; outages are frequent in the North Bay and the hills but rare in San Francisco, and gas furnaces die in outages too; and the statewide grid has had no Flex Alert since 2022, so the near-term squeeze is local wiring and who pays for it. The headline health claims ("as many as 85 premature deaths and 15,000 asthma attacks") describe the top of a modeled case that eliminates all targeted emissions; the 15,000 are asthma symptom days and inhaler uses. The verdict stands.
How to read this document
Every figure below comes from a source fetched on November 9, 2026 (Sections 3.7 to 3.12 were added in same-day revisions), listed in References with a working URL. Where the Air District or its consultants make a claim, it is labeled as their claim. Finding tags: Substantiated (documented in a primary source), Pending (not final or not yet published), Cleared (checked and not supported, or resolved), Unverified (claimed by someone but not confirmed by us).
Scope note: this policy entered the PolicyBombs backlog as "Alameda County natural gas elimination." Alameda County is one of the nine counties covered by the Bay Area Air Quality Management District (the "Air District" or BAAQMD), so these rules apply there. We did not find a separate Alameda County ordinance that bans gas furnaces or water heaters in existing homes (Unverified; see Section 1.6). Local "reach codes" for new buildings are a different thing and are covered separately so they are not blurred together.
1. What is the policy?
1.1 The two rules
- Rule 9-4 ("Nitrogen Oxides from Fan Type Residential Central Furnaces") covers furnaces under 175,000 BTU per hour and combination units with gas heat and electric cooling under 65,000 BTU per hour, the kind used in single-family and small multifamily homes. Source: Air District Rule 9-4 market assessment (Rincon, August 2026).
- Rule 9-6 ("Nitrogen Oxides Emissions from Natural Gas-Fired Boilers and Water Heaters") covers residential and commercial gas water heaters and boilers. It has limited NOx from gas water heaters since 1992. Source: Air District press release, November 4, 2026.
Both rules are point-of-sale standards. They set a zero nitrogen oxides (zero-NOx) emission limit for newly manufactured covered appliances after a compliance date. They do not require anyone to remove a working furnace or water heater, and they do not cover stoves, ovens, dryers, or fireplaces. Sources: Air District press release (Nov 4, 2026); Air District "Myths vs. Facts" sheet (Sept 1, 2026). Tag: Substantiated.
In practice, "zero-NOx" means electric. The Air District's furnace consultant states: "The only type of zero-NOx space heating technology currently available is electric appliances," and heat pumps are the cost-effective choice. Source: Rincon, Rule 9-4 market assessment (Aug 2026). Tag: Substantiated.
1.2 Adoption, March 15, 2023
The Air District Board adopted the zero-NOx amendments on March 15, 2023. Official resolution vote: 20 ayes, 0 noes, 1 abstention (Ray Mueller), 3 absent (David Haubert, David Hudson, Shamann Walton). Motion by Chair John J. Bauters, seconded by Director Sergio Lopez. Sources: Board Resolution 2023-03 and approved minutes of March 15, 2023. Tag: Substantiated.
Original compliance dates (applies to units manufactured after the date):
- January 1, 2027: water heaters under 75,000 BTU/hr (typical home tank water heaters).
- January 1, 2029: residential and commercial furnaces (Rule 9-4).
- January 1, 2031: water heaters from 75,000 BTU/hr to 2 million BTU/hr (larger, multifamily, commercial, tankless).
Source: Air District Final Staff Report on Rule 9-6 amendments (October 2026), Table 1. Tag: Substantiated.
1.3 November 4, 2026 amendments to Rule 9-6 (water heaters)
On November 4, 2026, the Board amended Rule 9-6. Per the Air District's press release:
- The small water heater zero-NOx date moved from January 1, 2027 to January 1, 2028.
- Exemptions for low-income property owners: income under 80 percent of Area Median Income, including participants in programs such as Medi-Cal or CalFresh, or households paying more than 28 percent of income toward mortgage and property taxes.
- Exemptions for space-constrained properties and for electrical limits (panels below 100 amps, insufficient panel capacity, or electrical runs over 50 feet).
- Temporary emergency installations allowed. Staff report: a licensed contractor may install a temporary gas unit, which must be removed within 12 months or approved under an exemption.
- A further delay to January 1, 2033 for water heaters in multifamily buildings, deed-restricted affordable housing, hydronic units, specialized high-heat uses, and large water heaters.
- Water heaters of 30 gallons or less and mobile home water heaters are not required to meet zero-NOx.
Sources: Air District press release 2026-041; Final Staff Report (Oct 2026). Tag: Substantiated.
The vote: CalMatters reported the Board "voted 16-1" with San Francisco Supervisor Shamann Walton voting no, Benicia Mayor Steve Young abstaining, and San Mateo County Supervisor Ray Mueller saying he wished the board could repeal the rule. The Palo Alto Daily Post reported Mueller walked out after about 20 minutes because repeal was not offered as an option ("We were basically boxed in"). Sources: CalMatters (Nov 4-5, 2026); Palo Alto Daily Post (Nov 5, 2026). Tag: Substantiated by two contemporaneous outlets. The official roll call (minutes) for November 4 was not yet posted when we checked. Tag for the full roll call: Pending.
KQED reported that residents claiming the income exemption "will attest to this by self-reporting through an online portal," and that electrical-constraint exemptions require a contractor. Source: KQED (Nov 4, 2026). Tag: Substantiated.
1.4 How big are the exemptions?
- About 20 percent of Bay Area households qualify for the income-based exemption (Air District estimate, via CalMatters).
- About 20 percent of installations would qualify for the one-time space or electrical exemption (Air District estimate, via CalMatters; consistent with the Air District cost memo of Oct 28, 2026, which cites a 20 percent "high cost" exemption share).
- Water heaters of 30 gallons or less are about 10 percent of sales (CalMatters).
- Staff conclusion: "up to 50 percent of small water heaters could be eligible for an exemption or extension," and the exemptions put "approximately half of the initially estimated emissions reductions associated with Rule 9-6 as adopted in 2023" potentially out of reach. Source: Final Staff Report (Oct 2026). Tag: Substantiated.
1.5 Rule 9-4 (furnaces) status
Rule 9-4 still prohibits sale and installation of most NOx-emitting residential furnaces manufactured after January 1, 2029. Source: Rincon Rule 9-4 market assessment (Aug 2026). The Final Staff Report on Rule 9-6 says "Staff does not recommend extending the compliance date beyond 2029 at this time," citing the furnace deadline and a possible EPA nonattainment designation for the 2024 annual PM2.5 standard. The Air District's Myths vs. Facts sheet says a cost and technology assessment for furnaces "will be completed before the 2029 compliance date," and the staff report says a fuller furnace report from the working group is "forthcoming in Fall 2026." Tag: 2029 date Substantiated; any furnace amendments Pending.
1.6 Not the same thing: local reach codes and the Berkeley case
- Berkeley's 2019 ordinance banned natural gas piping in new buildings. The California Restaurant Association sued and won at the Ninth Circuit (California Restaurant Association v. City of Berkeley, 89 F.4th 1094 (9th Cir. 2024)), which held the federal Energy Policy and Conservation Act (EPCA) preempted that kind of ban. Berkeley stopped enforcing the ordinance in 2024. Inside Climate News reported about 70 other California cities had adopted gas bans or electrification codes for new buildings, and most rescinded or pivoted. KQED reported San Mateo and Contra Costa counties paused their new-building gas bans. Sources: Inside Climate News (Sept 30, 2024); KQED; Ninth Circuit opinion in Rinnai (quoting CRA). Tag: Substantiated.
- The BAAQMD rules are different. They are emission standards adopted under Clean Air Act duties, and they apply to replacements in existing homes, not only to new construction. On July 2, 2026, the Ninth Circuit ruled in Rinnai America Corp. v. South Coast AQMD that EPCA does not preempt a zero-NOx emission standard adopted to meet Clean Air Act obligations, and noted: "The Bay Area enacted similar appliance standards in March 2023, and to date, no challenge to those standards has been filed." Source: Ninth Circuit opinion No. 25-5129. Tag: Substantiated.
- The California Apartment Association and San Francisco Apartment Association told the Board in August 2026 that they still maintain Rule 9-6 is preempted by EPCA "pending completion of further judicial review." Source: CAA/SFAA letter, Aug 13, 2026. Tag: Substantiated (that they hold this position); legal outcome Pending.
- Alameda County: we found no county-wide ordinance in Alameda County that separately bans gas furnaces or water heaters in existing homes. A search summary indicated the county's 2025 building code adoption contained no all-electric reach code, but the county PDF did not download for us to confirm. Tag: Unverified.
2. Why does it exist?
2.1 Stated reasons (the Air District's claims)
- Health: The Air District says pollution from gas water heaters and furnaces causes "as many as 85 premature deaths and 15,000 asthma attacks in the Bay Area each year," and that the 2023 rules would avoid up to $890 million a year in health impacts. Sources: press release (Nov 4, 2026); Myths vs. Facts (Sept 2026); Final Staff Report Table 7. Tag: Substantiated as the Air District's claim. What those numbers actually measure is checked in Section 3.12.
- Scale: Furnaces and water heaters account for about 89 percent of residential NOx emissions (ERG socioeconomic report citing a 2022 source). KQED reported staff said Bay Area gas water heaters and furnaces pollute "roughly equal to" passenger vehicles. Tag: Substantiated as the Air District's claim.
- Federal law: The Bay Area has ozone and particulate obligations under the Clean Air Act, and staff warn that EPA "may designate the Bay Area as nonattainment for the 2024 annual National Ambient Air Quality Standard for PM2.5." Source: Final Staff Report. Tag: Substantiated (as a stated risk); designation Pending.
- Climate co-benefit: Because compliant units are electric, the rules also cut greenhouse gases. The ERG report says climate is a co-benefit, not the primary purpose. Tag: Substantiated.
2.2 Honest underlying drivers
- State electrification policy. Governor Gavin Newsom (D) wrote to the California Air Resources Board on July 22, 2022 asking for a goal of 6 million heat pumps by 2030. CARB's own statewide zero-emission appliance plan has since been scaled back: CalMatters reports a December 2025 staff proposal to cap gas sales and use a credit system instead of a 2030 ban. Yet a state agency official sent the Bay Area Board a letter backing Rule 9-6. Sources: Governor's letter (July 22, 2022); CalMatters (Nov 2026). Tag: Substantiated. Reading: the Bay Area rule is now the leading edge of a state goal that the state itself softened.
- Market-making. SPUR's Sam Fishman told CalMatters the rules are "a strong market signal that can ramp up demand for heat pumps… from consumers, from contractors, from manufacturers at every level of the supply chain." The October 28, 2026 pro-rule press conference covered by KQED was held at a heat-pump contractor's shop (1-888 Heat Pumps in Emeryville). Tag: Substantiated. This is not evidence of wrongdoing; it shows that a rule sold on health also creates a guaranteed customer base for one industry.
- The other side has money in the fight too. Inside Climate News, citing a 2023 Sacramento Bee investigation, reported SoCalGas paid the law firm representing the California Restaurant Association in the Berkeley case more than $4 million from 2020 to 2022; the CRA called claims that SoCalGas funded its litigation "bogus." In the South Coast fight, CalMatters reported opposition was "fueled by an aggressive push of opposition from the gas and building industries." Tag: Substantiated as reported; no finding of impropriety.
- Federal pressure cuts the other way. In June 2025, the Trump administration's Justice Department warned the South Coast district it would sue to block similar (softer) sales-target rules; U.S. Attorney Bill Essayli posted that "feds set energy policy, not unelected climate bureaucrats." South Coast rejected its rules 7-5. Source: CalMatters (June 6, 2025). Tag: Substantiated. No federal suit against the Bay Area rules has been reported (Ninth Circuit, July 2026).
2.3 Data anomalies and process flags
- Comment counts are padded by petitions on the "support" side. Staff received letters from 1,137 commenters plus 6 petition letters with 3,411 signatures. In the theme table, "General support for Rule 9-6" shows 673 individual comments and 2,688 petition entries. "Upfront equipment / installation costs" drew 282 individual comments. Source: Response to Comments (Nov 3, 2026), Attachment 1. Tag: Substantiated. Small-number point: individual comment volume is far closer than the headline "support" total implies.
- Cost savings figure mixes two scenarios. The ERG executive summary (and CalMatters) say bill savings "offset approximately $60.8 million" of annual costs. But ERG's own Table 23 shows $60.8 million is the savings for the no-exemption scenario; the $372.8 million net figure for the adopted rule uses $46.8 million in savings ($419.6 million gross minus $46.8 million). Source: ERG Socioeconomic Analysis (Oct 2026), Table 23. Tag: Substantiated. Minor, but it overstates the bill savings attached to the adopted rule.
- Typo-level inconsistency in the cost study. The Task 1 cost report gives the ductless heat pump premium as $10,775 in its summary and $10,755 in Table 23 ($17,122 minus $6,347 equals $10,775). Source: Rincon/E3 Task 1 report. Tag: Substantiated. Minor.
- The "about $50 a year" water-heater bill savings is old math. ERG takes it from an E3 study and inflates it with the San Francisco-area electricity price index to about $51; the Air District's 2022 socioeconomic report says the E3 analysis was done in 2019. It was not re-run at 2026 PG&E gas and electric tariffs. Sources: ERG (Oct 2026); ADE Socioeconomic Report (Dec 2022). Tag: Substantiated. See Section 3.7.
- The Air District's Sept 2024 grid report says the average PG&E customer is out 114 minutes a year. PG&E's own filing shows system outage time of 213.5 to 283.8 minutes in 2022 and 226.7 to 460.1 minutes in 2024 (excluding and including major events). Tag: Unverified (district figure could not be reconciled). See Section 3.9.
- The Task 1 study gives the ratepayer-funded service-line allowance as $3,225 in its summary and $3,255 in its body. Tag: Substantiated. Minor.
- "15,000 asthma attacks" is a relabeled endpoint. The district's own table calls the 15,000 "asthma symptoms/albuterol use" and values them at about $5,900 a year in total; new asthma cases are 110 a year. The 85 deaths is the top of a 37 to 85 range for eliminating all targeted emissions including primary soot; the NOx-driven range is 23 to 52. Sources: 2023 Final Staff Report, Table 5-7; 2026 Final Staff Report, Table 7. Tag: Substantiated. See Section 3.12.
- Unit slip in the modeling appendix: Appendix E's summary reports the ozone change as "-0.021 µg/m3"; its body and figure use ppb. Tag: Substantiated. Minor.
- Self-attestation. Income exemptions are self-reported through an online portal (KQED). Any self-attested exemption invites misuse and makes enforcement hard. Staff expect about $3 million a year in initial implementation cost, to be recovered through "a moderate processing fee charged to property owners who apply for project specific exemptions due to space or electrical constraints." Source: Final Staff Report. Tag: Substantiated (design and cost estimate); misuse rate Unverified (no data yet).
- Project completion. A commenter said about 40 percent of willing homeowners in a program did not finish projects; staff did not confirm or rebut the number. Source: Response to Comments. Tag: Unverified.
- Unpermitted installs and cross-border buying. Commenters raised the risk of unpermitted gas installs and buying non-compliant units outside the Bay Area; staff pointed to contractor research and the extra year. Source: Response to Comments. Tag: Unverified (risk raised; no data).
- Board options. Mueller said the Board was offered only two options (adopt amendments or keep the 2027 rule unchanged), not repeal. Source: San Francisco Chronicle and Palo Alto Daily Post (Nov 2026). Tag: Substantiated as his account.
3. Realized effects so far, and what the numbers say will happen
Nothing has taken effect yet for homeowners. The first zero-NOx date is now January 1, 2028. So "realized effects" today are mostly: two rounds of delay and carve-outs, incentives counted in the cost studies disappearing, and a housing-industry fight. The rest is projection from the Air District's own studies.
3.1 Furnaces: what Rule 9-4 does to cost
The Air District's Task 1 cost study (Rincon for E3, Version 2.0, January and September 2024), based on Bay Area incentive-program data:
- Average upfront cost to replace a gas furnace: $6,347 (median of 2,945 BayREN installations in single-family homes).
- Heat pump HVAC in a single-family home: $17,122 ductless, $20,408 ducted.
- Increase before rebates: $10,775 (ductless) to $14,061 (ducted).
- In multifamily homes, heat pump HVAC costs $11,816 (ductless) and $24,647 (ducted) per unit; the study could not compute a premium because it had no gas baseline.
- If a household also needed or wanted new air conditioning, avoided AC cost of $8,106 drops the premium to $2,669 (ductless) and $5,955 (ducted).
- After incentives, the study found moderate- and high-income households still paying $4,855 to $7,755 more for ductless and $8,161 to $11,061 more for ducted systems (without counting avoided AC).
Source: Task 1 report, Executive Summary and Tables 1, 23, 24, 36, 37. Tag: Substantiated.
Key problem: the incentives counted are not all there anymore.
- The study's incentive tables include a $2,000 federal tax credit (Section 25C). The One Big Beautiful Bill Act ended 25C for property placed in service after December 31, 2025. Source: IRS FAQ on OBBB energy credits. Tag: Substantiated.
- The study's low- and moderate-income tables include up to $8,000 from the federal HEEHRA rebate. As of February 24, 2026, HEEHRA single-family rebates were "fully reserved for projects statewide"; Phase II is "not yet available." Sources: TECH Clean California HEEHRA page; California Energy Commission IRA rebates page. Tag: Substantiated.
- PolicyBombs arithmetic (removing only those two federal items, holding every other number in the district's tables constant): a ducted heat pump replacing a gas furnace now runs roughly $10,161 to $13,061 more than a new gas furnace, for low-, moderate-, and high-income households alike, before any avoided AC credit. (The study had shown $161 to $3,061 for lower-income and $8,161 to $11,061 for moderate- and high-income households.) Tag: Substantiated arithmetic on district figures; actual local rebate amounts change often and may be higher or lower.
- Panel upgrades: the same study puts typical panel upgrades at $2,750 to $4,250 and notes PG&E service upgrades can range from $1,000 to $60,000 or more. Source: Task 1 report. Tag: Substantiated.
Furnaces are where most of the pollution benefit lives. Staff say water heaters account for about 18 percent of the emission reductions estimated for the 2023 package; "the majority of emissions reductions are associated with appliance replacements under Rule 9-4." Source: Final Staff Report. Tag: Substantiated. That means the costliest part of the policy for families, the furnace swap, is also the part the Board has not yet re-examined.
3.2 Water heaters: what Rule 9-6 does to cost
- Average installed cost: heat pump water heater $7,071 vs. tank gas water heater $3,575; premium $3,496. Sources: Task 1 report; ERG Table 12 and 13. The Air District has used $3,496 since December 2024. Tag: Substantiated.
- Newer bid studies run higher on both sides: TECH Clean California contractor bids averaged $8,549 (2024) and $9,821 (2025) for heat pump water heaters, with premiums of $3,990 and $3,174. Source: Air District memo, Oct 28, 2026. Tag: Substantiated.
- In San Francisco's Climate Equity Hub program, 115 installs in mostly older homes ranged from $7,000 to $14,552; 79 of the 115 needed added site work. Source: Air District memo. Tag: Substantiated.
- Region-wide: ERG estimates annualized net compliance costs of about $372.8 million a year for households under the amended rule, after bill savings and exemptions; the exemptions save $97.9 million a year versus the 2023 rule. Source: ERG Socioeconomic Analysis (Oct 2026). Tag: Substantiated.
- Per household: annualized cost increase about $384 for owners and $395 for renters; for renters, about $32.88 a month, or 1.2 to 1.5 percent of median rent. For the lowest-income bracket, the annualized cost would raise typical appliance spending by about 72 percent. Source: ERG Tables 15, 17, 18. Tag: Substantiated.
- Bill savings are small. ERG uses E3's estimate that a heat pump water heater saves about $50 a year on utility bills in a single-family home and $40 in a multifamily unit. CalMatters: because electricity often costs more than gas in California, "savings on utility bills are smaller." Some commenters said newer studies show $230 to $450 a year in savings after PG&E's 2026 rate changes; staff did not adopt those numbers. Tag: $50/$40 Substantiated (district's consultant); $230 to $450 Unverified.
- Jobs: ERG's text says reduced household spending could cost about 1,300 jobs, and up to 2,100 including indirect and induced effects. But its Table 25 assigns those figures (1,268 direct, 2,079 total) to the no-exemption scenario, and 1,654 total jobs to the adopted rule, with about 425 jobs saved by the exemptions. Source: ERG. Tag: Substantiated (another small text-versus-table mismatch).
- Volume: Air District staff estimate up to 120,000 Bay Area households replace a water heater each year. Source: Final Staff Report. Tag: Substantiated.
3.3 Cost vs. benefit on the district's own numbers
- Health value staff assign to eliminating all gas water-heating emissions: up to $160 million a year. With the low-income exemption, up to $112 million a year, with complete implementation expected by 2059. Source: Final Staff Report, Table 8. Tag: Substantiated.
- An Air District spokesperson told CalMatters the amended rule would prevent up to 16 premature deaths and 21 new asthma cases a year and avoid $90 million in healthcare costs. Tag: Substantiated as the district's claim.
- Household cost of the amended water-heater rule: about $372.8 million a year (ERG).
- Plain reading: the yearly cost to households is more than double the highest yearly health value staff put on the water-heater piece, and about four times the $90 million figure the spokesperson cited. Caveat: the cost is annualized over a 13-year implementation window at a 7.7 percent discount rate, while benefits are a steady-state valuation in 2020 dollars, so the comparison is directional, not exact. Tag: Substantiated (inputs); comparison is PolicyBombs analysis.
3.4 Heater quality and performance
Furnaces (Rule 9-4):
- There is no zero-NOx gas furnace on the market; compliance means electric, almost always a heat pump. Source: Rincon market assessment. Tag: Substantiated.
- Efficiency: the consultant, citing RMI, says modern air-source heat pumps run at 2.2 to 4.5 times the efficiency of high-efficiency gas furnaces on an annual basis, with lower efficiency in very cold climates, and "perform the best in moderate climates like the Bay Area's." The district's claim; independent field data in Bay Area homes were not provided. Tag: Substantiated as consultant claim.
- Comfort and install quality risks named by the district's own consultant: "Higher and more variable installation costs due to complex installation" when existing ductwork is reused, possible "differences in comfort levels across a home," homeowner concerns about aesthetics and zonal control, supply chain pressures, and the refrigerant transition. Manufacturers announced 2025 price increases of 2 to 10 percent on residential HVAC (Daikin 7 percent on mini-splits; Bosch 2 percent). Source: Rincon market assessment. Tag: Substantiated.
- Upside: a heat pump also cools. The Task 1 study credits $8,106 in avoided AC cost for households that need or want air conditioning. If you did not want AC, that credit does nothing for you. Tag: Substantiated.
- Power outages: a heat pump does not run without power. Central gas furnaces also need electricity for their fans and controls, so outage resilience is the same for the central systems Rule 9-4 covers. Source: Air District FAQ. Tag: Substantiated. See Section 3.9 for how often and where the power goes out.
Water heaters (Rule 9-6):
- Recovery and sizing: installers commonly recommend upsizing (for example 55 to 65 gallons) because heat pump water heaters are most efficient heating slowly; in resistance mode they use more power. Source: Task 1 report. Tag: Substantiated.
- Space and airflow: the amended rule exempts closets under 700 cubic feet that cannot take a louvered door, grille, or ducts, and low ceilings (garages under 7.2 feet; other indoor spaces under 6 feet). Condensate drainage is required. Source: Response to Comments. Tag: Substantiated.
- Noise: "HPWHs typically emit noise levels between 45 and 55 decibels," per staff. Tag: Substantiated as district claim.
- Electrical: staff say heat pump water heaters average about 550 watts, and newer 120-volt plug-in units can avoid extensive electrical work for smaller households. Statewide, 3 percent of single-family homes have panels under 100 amps; in disadvantaged communities, 8 percent. Source: Final Staff Report; Response to Comments. Tag: Substantiated.
- Outages: staff say tank heat pump water heaters "can stay hot for several hours" in an outage and that many new gas water heaters also need electricity. Tag: Substantiated as district claim.
- Satisfaction: staff cite two TECH Clean California surveys in which "the majority" of heat pump water heater owners were satisfied. Tag: Substantiated as district claim; the surveys cover volunteers in a rebate program, not people forced to switch.
- Exempt households keep buying gas units (ultra-low NOx), so their heater quality does not change. Tag: Substantiated (rule design).
Bottom line on quality: in the Bay Area's mild climate, a well-installed heat pump is a capable heater and adds cooling. The quality risk is not the technology; it is retrofit fit in older homes (ducts, closets, panels) and installer skill, which is exactly where costs spike and where the rule now leans on one-time exemptions.
3.5 Who pays: owners, renters, multifamily
- Owners pay directly at burnout. Low-income owners can opt out.
- Renters cannot use the low-income exemption, which "appl[ies] specifically to homeowners"; ERG assumes renters bear costs through rent increases. Source: ERG. Tag: Substantiated.
- Multifamily: the 2033 delay covers buildings with five or more units and deed-restricted affordable housing (KQED; Response to Comments). The California Apartment Association's Joshua Howard said the mandate "doesn't take into account all the nuances" of 1960s and 1970s buildings. California Rental Housing Association president Adam Pearce said the rule "kicks the issue down the road" and that an incentive-based approach would get "a lot more buy-in." Source: CalMatters. Tag: Substantiated.
- Staff argue exemptions for "substantial repair" scenarios greatly decrease "renoviction" risks. Source: Final Staff Report. Tag: Substantiated as district claim.
3.6 Counter-analyses
- Air District and allies: costs fall as the market matures; incentives exist; the Bay Area will receive about $55 million a year in heat pump incentive funds over the next few years (SPUR estimate via CalMatters); a statewide heat pump water heater rebate of up to $2,500 runs from June 1, 2026 to March 1, 2028 (Switch Is On listing). SB 222 (Wiener), signed in September 2026 per the staff report, streamlines heat pump permits and caps permit fees. Tag: Substantiated as reported; durability of funding Pending.
- South Coast comparison: the L.A.-area district estimated a heat pump costs about $2,000 more than a gas water heater and replacing just a furnace about $8,000 more, while a full HVAC replacement could cost the same or less. Source: CalMatters (June 2025). Tag: Substantiated as that district's estimate.
- Industry and landlord groups: the CAA/SFAA letter says the amendments are "a step in the right direction" but still fail to account for impacts on existing rental housing, and preserves its EPCA preemption argument. Tag: Substantiated.
3.7 Electricity prices: what PG&E power costs
Three questions matter for a rule that moves home heating onto the electric grid: what Bay Area electricity costs, how often it goes out, and whether the grid is already stressed. Short version: power here is very expensive, which matters a lot for furnaces and less for water heaters. Outages are frequent in PG&E's North Bay, Sonoma, Peninsula, De Anza and Diablo divisions, and rare in San Francisco. The statewide grid has not hit a Flex Alert since 2022. The tighter squeeze is the wires and service connections on individual streets, and who pays to upgrade them.
- PG&E's residential bundled non-CARE average rate was 40.60 cents per kilowatt-hour (kWh) as of March 1, 2026. Path in PG&E's own rate advisories: 43.15 cents (July 1, 2024), 43.38 (Sept 1, 2024), 44.66 (Oct 1, 2024), 44.65 (Jan 1, 2025), 45.33 (March 1, 2025, the high point in the advisories we fetched), 44.36 (Sept 1, 2025), 41.46 (Jan 1, 2026), 40.60 (March 1, 2026). Source: PG&E Electric Rate Advisories. Tag: Substantiated.
- PG&E's typical 500 kWh monthly bill: $203.54 non-CARE and $117.42 CARE as of March 1, 2026. CARE customers get a discount of about 42 percent on electric bills. Source: PG&E Electric Rate Advisory, March 2026. Tag: Substantiated.
- Longer run: the CPUC says PG&E average electric rates (all bundled customers, not only residential) rose about 45 percent between January 1, 2021 and March 1, 2026, versus about 23 percent if they had tracked inflation, an average of about 9 percent a year. Source: CPUC Electric Affordability page. Tag: Substantiated.
- Outlook: the CPUC's Oct 28, 2026 rates fact sheet projects residential rates rising about 4 to 6 percent a year through 2029, faster than its assumed 3.2 percent inflation. Wildfire costs were 25.4 percent of PG&E's 2025 electric revenue requirement, and wildfire costs plus rooftop-solar cost shifts add roughly $45 to $60 to a typical monthly bill for customers without solar. Source: CPUC fact sheet (Oct 28, 2026). Tag: Substantiated.
- National comparison: EIA reports the average U.S. residential price was 18.16 cents per kWh in August 2026, and California's was 29.75 cents. PG&E's March 2026 residential average (40.60 cents) is about 2.2 times the U.S. August 2026 average. Different months and definitions, so treat it as directional. Source: EIA Electric Power Monthly Table 5.6.A. Tag: inputs Substantiated; ratio is PolicyBombs arithmetic.
- Not everyone is on PG&E. Palo Alto's city utility says its median residential electric bill is $89 a month versus $160 in neighboring PG&E-served cities (FY2026 rates). Customers of city utilities face cheaper electric math than PG&E customers. We did not fetch current Silicon Valley Power (Santa Clara) or Alameda Municipal Power rates this run. Source: City of Palo Alto Utilities Rates page. Tag: Palo Alto Substantiated; other municipal utilities Unverified.
- Community choice aggregators (CCAs) such as Ava, Peninsula Clean Energy, SVCE, MCE, CleanPowerSF and Sonoma Clean Power sell generation but customers still pay PG&E delivery charges. We did not model CCA generation rates. Tag: Gap.
- Gas got more expensive too. PG&E's residential gas schedule G-1, effective Nov 1, 2026, charges $2.53545 per therm for baseline use and $3.03857 per therm above baseline. EIA's average California residential gas price rose from $12.95 per thousand cubic feet in 2019 to $22.01 in 2025, about 70 percent (PolicyBombs arithmetic). The CPUC says PG&E's residential gas rate rose over the past five years but was relatively stable from 2023 through 2025. Sources: PG&E G-1 tariff; EIA; CPUC fact sheet. Tag: Substantiated.
- New fixed charge: since March 1, 2026 PG&E charges a Base Services Charge on residential bills ($0.79343 a day, about $24 a month, for most customers; $0.19713 a day for CARE-income customers) and lowered per-kWh prices to offset it. Lower per-kWh prices help anyone adding electric heating. Source: PG&E E-TOU-C and E-ELEC tariffs; March 2026 advisory. Tag: Substantiated (monthly figure is PolicyBombs arithmetic).
- What the Air District assumed. ERG's "about $50 a year" water-heater bill savings (and $40 for multifamily) comes from an E3 study; ERG inflated it to about $51 and $41 using the consumer price index for electricity in the San Francisco area. The Air District's earlier socioeconomic report says that E3 analysis was done in 2019. Inflating a 2019 savings estimate by one fuel's price index is not the same as re-running bills at 2026 gas and electric tariffs. Sources: ERG Socioeconomic Analysis (Oct 2026); ADE Socioeconomic Report (Dec 2022). Tag: Substantiated (sourcing); the critique is PolicyBombs analysis.
- The district's newer Task 1 study did use 2024 PG&E rates (January 2024 and July 2024, with the income-graduated fixed charge) for about 1,500 East Bay customers. It found most customers who electrify space and water heating see lower bills (average decrease $23 a month) while about 27 percent see increases (average $5 a month). For water heaters alone, about 35 percent of single-family and 60 percent of multifamily low-use non-CARE customers would see bills rise about $2 a month. It also found "Residents who stayed on standard Time of Use rates did not see cost savings in most cases," and that an electrification rate such as E-ELEC is key. Source: Rincon/E3 Task 1 report. Tag: Substantiated.
3.8 Running costs: does a heat pump still save money at PG&E prices?
This is PolicyBombs arithmetic on sourced inputs. It is not an official figure and is kept out of the X post.
Method: cost to deliver one therm of heat equals fuel price divided by appliance efficiency. One therm equals 29.307 kWh. Inputs:
- PG&E electric energy rates in effect when fetched Nov 9, 2026 (tariff sheets effective June 1, 2026): E-TOU-C (PG&E's standard time-of-use plan) winter off-peak $0.36757, winter peak $0.39757, summer off-peak $0.39940 per kWh; E-ELEC (optional plan for homes with a heat pump, EV, or battery) winter off-peak $0.28468, winter peak $0.32063 per kWh. Baseline credits and CCA generation rates not applied.
- PG&E gas G-1: $2.53545 (baseline) and $3.03857 (above baseline) per therm.
- Federal minimum gas furnace efficiency: 80 percent AFUE for non-weatherized gas furnaces made before Dec 18, 2028, rising to 95 percent for units made on or after that date (10 CFR 430.32).
- Federal minimum gas storage water heater (40 gallons, medium draw): UEF 0.58, from the federal formula 0.6483 minus 0.0017 times rated gallons (10 CFR 430.32).
- ENERGY STAR heat pump water heater: UEF at least 3.30.
- Federal minimum split-system heat pump: HSPF2 7.5 (DOE, Jan 1, 2023), which converts to a seasonal efficiency of about 2.2 units of heat per unit of electricity (HSPF2 divided by 3.412), measured under DOE's test climate.
Results:
- Electricity costs $10.77 per therm-equivalent on E-TOU-C winter off-peak, $11.65 at winter peak, and $8.34 on E-ELEC winter off-peak.
- Gas furnace heat costs $3.17 per therm delivered at 80 percent efficiency on baseline gas ($3.80 above baseline), and $2.67 at 95 percent ($3.20 above baseline).
- Water heaters: an ENERGY STAR heat pump water heater (UEF 3.30) delivers a therm of hot water for $2.53 (E-ELEC winter off-peak) to $3.55 (E-TOU-C summer off-peak). A federal-minimum 40-gallon gas tank costs $4.37 (baseline gas) to $5.24 (above baseline). The heat pump water heater is cheaper to run on every PG&E plan we checked; to lose, it would need an efficiency of only about 1.6 to 2.7. Bottom line: high PG&E rates shrink the water-heater savings but do not erase them. That is consistent with the district's claim that savings exist. We did not re-estimate dollars per year because we did not find a sourced Bay Area household hot-water usage figure. Tag: PolicyBombs arithmetic.
- Furnaces: to match an 80 percent gas furnace, a heat pump needs a seasonal efficiency between about 2.2 (E-ELEC off-peak versus above-baseline gas) and 3.7 (E-TOU-C winter peak versus baseline gas). To match a 95 percent furnace, it needs about 2.6 to 4.4. A federal-minimum heat pump rates about 2.2 under DOE's test climate. The Bay Area's mild winters should do better, and the district's consultant says heat pumps run 2.2 to 4.5 times as efficiently as high-efficiency furnaces, but the district record we reviewed has no Bay Area field data. Reading: on E-ELEC, a good heat pump likely costs less to run than an older 80 percent furnace. On PG&E's standard E-TOU-C plan, a heat pump can cost more to run than a 95 percent furnace. That matches the Task 1 finding that customers on standard time-of-use rates mostly did not save. Tag: PolicyBombs arithmetic.
- Caveats: gas furnaces also use electricity for blowers (not counted, which slightly favors the heat pump); a heat pump replaces an old air conditioner with more efficient cooling (favors the heat pump); CARE and FERA discounts, baseline credits, and CCA rates change the answer; and real-world efficiency depends on installation.
3.9 Outages: how often the power goes out, and where
System-wide (PG&E's 2024 Annual Electric Reliability Report to the CPUC, Table 2, which excludes planned and grid-operator outages):
- 2024: the average PG&E customer was out 460.1 minutes (about 7.7 hours) over 1.965 sustained outages, counting major storms and events. Excluding major event days: 226.7 minutes and 1.637 outages. In 2023: 669.4 minutes and 2.065 outages. Tag: Substantiated.
- Trend: the CPUC's independent safety monitor (May 26, 2026) says PG&E's outage-duration index, excluding major event days, rose 188 percent from 96 minutes in 2015 to 276 minutes in 2024, then fell to 223.7 minutes in 2025, which still places PG&E in the fourth (worst) quartile of U.S. utilities. PG&E's own report blames wildfire-prevention settings (EPSS fast-trip and PSPS shutoffs) and storms. Sources: ISM Status Update Report (May 26, 2026); PG&E 2024 reliability report. Tag: Substantiated.
- National comparison: EIA says U.S. customers averaged 11 hours of interruptions in 2024 counting major events (driven by hurricanes Beryl, Helene and Milton, and nearly twice the prior decade's average), and interruptions not tied to major events "routinely average about two hours per year." The U.S. average was 1.5 interruptions in 2024. PG&E's 2024 non-major-event figure (226.7 minutes, about 3.8 hours) is roughly double the national routine level. Source: EIA Today in Energy (Dec 1, 2025). Tag: inputs Substantiated; comparison is PolicyBombs analysis (definitions are close but not identical).
Bay Area divisions, 2024, including major events (outage minutes per customer / number of sustained outages). PG&E divisions do not follow county lines exactly:
- San Francisco: 97.5 minutes (about 1.6 hours) / 0.677
- East Bay: 166.5 (about 2.8 hours) / 1.302
- Mission: 177.6 / 1.390
- Diablo: 321.6 / 2.170
- San Jose: 402.7 / 1.626
- De Anza: 471.1 / 2.020
- Peninsula: 597.2 (about 10 hours) / 1.970
- North Bay: 745.6 (about 12.4 hours) / 2.471
- Sonoma: 798.1 (about 13.3 hours) / 2.319
- Storm year 2023: Peninsula 1,241.3 minutes; De Anza 1,491.8; San Francisco 138.3. PSPS year 2019: Sonoma 3,871.1; North Bay 3,518.1.
Source: PG&E 2024 Annual Electric Reliability Report, Table 5. Tag: Substantiated (hours are PolicyBombs arithmetic).
Public Safety Power Shutoffs (PSPS) and storms:
- PG&E PSPS customers affected: 2,014,000 in 2019; 653,000 in 2020; 80,400 in 2021. Source: PG&E briefing to the CPUC (Feb 2022). Tag: Substantiated.
- PSPS still happens in parts of the Bay Area. In October 2026, PG&E announced shutoffs for about 90,000 customers in 29 counties; Bay City News reported 4,720 affected in Alameda County, 1,607 in Contra Costa, 2,915 in Napa, 32 in Solano and 2,044 in Sonoma, some without power "for days." Source: NBC Bay Area / Bay City News (Oct 16, 2026). Tag: Substantiated.
- Winter storms: on Christmas evening 2025, after a series of atmospheric rivers, PG&E said 94,890 Bay Area customers were still without power, including about 78,000 in the North Bay (mostly Sonoma County), 7,000 in the East Bay, 4,994 on the Peninsula and 896 in San Francisco. Source: KTVU (Dec 25, 2025). Tag: Substantiated. These are winter outages, exactly when heat is needed.
- Anomaly in the district's record: the Air District's Grid Reliability report (Rincon/E3, Sept 2024) says the average PG&E customer has 1.6 outages a year "or a total of 114 minutes per year." We could not match 114 minutes to any PG&E system figure for 2019 to 2024 in PG&E's own filing; the 2022 figures were 213.5 minutes excluding major events and 283.8 including them. Tag: Unverified (district figure appears to understate outage time).
The claim that power goes out "relatively frequently": Substantiated for the North Bay, Sonoma, Peninsula, De Anza (roughly the west Santa Clara County area), Diablo (roughly the Contra Costa area; division boundaries are approximate) and San Jose divisions, where customers averaged about 1.6 to 2.5 sustained outages and roughly 5 to 13 hours without power in 2024. Overstated for San Francisco (under one outage and about 1.6 hours in 2024) and, in 2024, PG&E's East Bay division (about 2.8 hours), which were at or below the 2024 U.S. average.
What still works in an outage:
- Heat pump furnace: no heat. A gas forced-air furnace: also no heat, because it needs electricity for its fan and controls. The Air District says central gas furnaces "rely on electric fans" and "will not operate during a power outage." So for the central systems Rule 9-4 covers, an outage leaves you cold either way. Source: Air District FAQ (July 2026); Rincon/E3 grid report. Tag: Substantiated.
- Water heaters: a tank heat pump water heater "can stay hot for several hours" (district claim). Gas tankless heaters and some gas tanks with electric ignition also stop without power (district). A conventional gas tank without electric ignition keeps heating. In a multi-day PSPS or storm outage, that is a real resilience loss for families in outage-prone areas once the stored hot water runs out. Sources: Air District FAQ; Response to Comments (Nov 3, 2026). Tag: district statements Substantiated; the multi-day comparison is PolicyBombs analysis.
- Backup power: a heat pump draws more power than a furnace fan, which makes small-generator backup harder. Tag: Unverified (plausible, not quantified in the sources we fetched).
3.10 Grid stress: is there enough power, and enough wire?
Statewide supply (the "Flex Alert" grid):
- Flex Alerts: 11 days in 2022, then zero in 2023, 2024, 2025 and 2026 to date. Energy emergency alerts: in 2022, 6 days at EEA1, 5 at EEA2 and 1 at EEA3; in 2023 one EEA1 day; none at EEA1 or higher in 2024, 2025 or 2026. CAISO's older table shows two Stage 3 emergency days in 2020. Source: CAISO Grid Emergencies History Report (revised Oct 9, 2026). Tag: Substantiated.
- CAISO's 2026 Summer Assessment found a 2,547 MW surplus against its one-day-in-ten-years planning target, plus about 3,379 MW of emergency supply, and its overview page says more than 16,000 MW of batteries have been added since 2020. It warns the analysis does not cover coincident extreme events such as region-wide heat or wildfires. Source: CAISO (May 2026). Tag: Substantiated.
- CAISO's 2025 peak was 44,506 MW (Aug 21), below 48,323 MW in 2024. Peak net imports, 11,078 MW, came on Dec 16, 2025 at 3:30 a.m., a winter night, which is when heating load would land. Source: CAISO 2025 Statistics. Tag: Substantiated; the winter-night reading is PolicyBombs analysis.
- So "the grid is already stressed" is true of 2020 and 2022, but not supported for statewide supply in 2023 through 2026. Tag: Cleared for 2023 to 2026 bulk supply; extreme-event risk Pending.
Growth ahead:
- The CEC's 2025 demand forecast puts PG&E's annual peak at 20,718 MW in 2025, 23,414 MW in 2030 and 27,394 MW in 2035 (planning case), or 33,314 MW in 2035 in the local-reliability case with "known loads" such as data centers. CAISO's peak rises from 46,479 MW (2025) to 57,350 MW (2035). Source: CEC 2025 IEPR forecast slides (Jan 5, 2026). Tag: Substantiated. Electrification of buildings and vehicles plus data centers means the grid must grow about a third in a decade (PolicyBombs arithmetic on the PG&E planning case).
- Rule-specific: the Air District's grid consultant (E3, Appendix D, Dec 2022) modeled the worst case, every gas furnace and water heater replaced with electric at burnout. Result: 6.2 terawatt-hours a year of added load by 2050 (2.2 percent of 2020 statewide load, per the 2023 staff report), with "the largest potential load impacts … in winter night and morning hours." Against a low-electrification baseline it needs 2,180 MW of solar, 680 MW of batteries, 460 MW of transmission and 420 MW of local distribution capacity, including 45 new feeders, 42 feeder upgrades, 6 new substation banks and 31 bank upgrades, at about $380 million (2021 dollars) for distribution. Against a high-electrification baseline the net 2050 effect is negligible, but costs arrive earlier (about $100 million). Sources: E3 Appendix D; 2023 Final Staff Report. Tag: Substantiated.
- Who pays: the Air District's 2022 socioeconomic report says PG&E would need about $100 million for transmission and $384 million for distribution, plus about $1.95 billion of solar and storage, and that "it is possible that these investments will result in some future rate increases." Ratepayers pay through rates. Source: ADE Socioeconomic Report (Dec 2022). Tag: Substantiated.
- Your own connection: the Task 1 study says panel upgrades typically run $2,750 to $4,250 and PG&E service upgrades from $1,000 to $60,000 or more; ratepayers fund an allowance (stated as $3,225 in the summary and $3,255 in the body) and the customer pays the rest. PG&E estimates for three East Bay neighborhood-electrification sites put service upgrades at $10,000 to $60,000 per customer and final transformer upgrades at an average of $1,033 per customer. The district's grid report says service upgrades usually take 10 to 30 days but can take up to eight months. Sources: Task 1; Grid Reliability report (Sept 2024). Tag: Substantiated (the $3,225 versus $3,255 mismatch is a minor document inconsistency).
- Exemptions cover some of this for water heaters only: the Nov 4, 2026 amendments exempt panels under 100 amps, insufficient panel capacity, and electrical runs over 50 feet. Furnaces have no comparable exemption yet. Tag: Substantiated.
Does burnout timing change the near-term grid picture? Mostly yes, it softens it.
- Up to 120,000 Bay Area households replace a water heater each year, and staff estimate up to half could be exempt. Staff say heat pump water heaters average about 550 watts. Illustrative upper bound: 120,000 units times 0.55 kW is 66 MW if every one ran at once, about 0.3 percent of PG&E's 2025 peak forecast. Real coincident load would be lower. Tag: PolicyBombs arithmetic on district and CEC figures.
- Furnaces start in 2029 and turn over as units fail (the district's 2022 report uses an 18-year service life for HVAC), so heating load builds over many years and lands mainly on winter nights and mornings, when California's system is not at its summer peak.
- Reading: the Rules are not what strains the statewide grid in 2028 to 2030. The real near-term limits are individual panels, service drops and neighborhood transformers, and the bill for upgrading them. The Air District says new water-heater load is "highly unlikely to cause power outages" and that most outages come from "physical impacts (downed trees, storms) or public safety power shutoffs." PG&E's data back the second half: outages here are about weather and wildfire safety, not too little power. Source: Response to Comments (Nov 3, 2026). Tag: Substantiated as the district's claim; consistent with the reliability data above.
3.11 What the electricity evidence adds up to
- Price: high PG&E rates do not sink the water-heater case on running costs. They make the furnace case depend on the rate plan. A family on PG&E's standard plan could pay $14,061 more up front and still not see lower heating bills. That strengthens the case for re-costing Rule 9-4 with 2026 tariffs before 2029.
- Outages: concentrated in the North Bay, the hills, and wildfire zones, not in San Francisco. For central furnaces there is no resilience difference. For water heaters there is a real loss in multi-day outages in those areas, which the 2026 exemptions do not address.
- Grid: the statewide supply grid is in better shape than in 2020 to 2022. The local wires and who pays for them are the near-term problem, and families pay twice: once at the panel and again in rates.
3.12 Clean air, defined and measured
"Clean air" here means the official, health-based measures that apply to this rule, not a slogan. Rules 9-4 and 9-6 are NOx emission standards, so the test is how much NOx they remove and what that does to the pollutants NOx helps form.
The official yardsticks (EPA National Ambient Air Quality Standards and California standards, as listed by the Air District):
- Nitrogen dioxide (NO2), the regulated form of NOx: federal 1-hour standard 100 ppb and annual 53 ppb. The Bay Area is in attainment of both (Air District standards page). EPA's 2023 to 2025 design-value table marks Bay Area NO2 values invalid because 2025 data were incomplete. Tag: Substantiated.
- Ozone (smog), which NOx helps form: federal 8-hour standard 70 ppb. The Bay Area is nonattainment (Marginal). The regional 8-hour design value was 0.070 ppm for 2021 to 2023 (highest site: Livermore), exactly at the standard; EPA lists the 2022 to 2024 and 2023 to 2025 values as incomplete. Sources: Air District standards page; EPA ozone design values (June 2026). Tag: Substantiated.
- Fine particles (PM2.5), partly formed from NOx: federal 24-hour standard 35 micrograms per cubic meter, where the Bay Area is still designated nonattainment (Moderate) even though EPA's area design value was 25 for 2021 to 2023 and 2022 to 2024; and the 2024 annual standard of 9.0, where designation is still pending. CARB recommended nonattainment based on a 2021 to 2023 design value of 9.6 at San Pablo; EPA's site table shows San Pablo at 9.8 for 2022 to 2024. EPA has told California it may finalize designations on 2023 to 2025 data; a court ordered final designations by Feb 6, 2027, which EPA is appealing. Sources: Air District standards page; CARB recommendation; EPA PM2.5 design values (June 2026); EPA letter to California (Sept 29, 2026). Tag: Substantiated; annual PM2.5 designation Pending.
- Indoor air: furnaces and water heaters vent outdoors. The Air District says its health benefits are outdoor benefits, while noting that appliances "may not be vented properly and gas pipes in homes often leak, contributing to poor indoor air quality." Source: Air District FAQ (July 2026). Tag: Substantiated (the district's framing). No quantified indoor estimate for these appliances was found in the district record. Tag: Gap.
The metric used in this pack: (1) tons of NOx removed per year from the Bay Area inventory, the district's own primary measure, and (2) the district's modeled change in outdoor PM2.5 and ozone where people live, compared with the standards above. Health counts and dollar values are treated as derived outputs of a model, not as measurements. No composite "clean air score" is used.
Baseline (2018 inventory, from the 2023 staff report and its modeling appendix):
- Residential gas space heating emitted 2,410 tons of NOx a year and residential gas water heating 828 tons (3,238 tons combined). Commercial space and water heating added 1,028 tons. Source: 2023 Final Staff Report, Table 5-1. Tag: Substantiated.
- All appliances targeted by the rules: 4,267 tons. Existing Rule 9-6 limits were already expected to remove 576 tons, so the 2023 amendments target the remaining 3,690 tons. Source: 2023 staff report; Appendix E. Tag: Substantiated.
- Total Bay Area NOx in 2018: 69,740 tons. The 3,690 tons are 5.3 percent of it. All residential and commercial gas combustion is 7.5 percent of regional NOx, against 39 percent from on-road vehicles and 36 percent from off-road engines; within the Air District's own stationary-source authority it is 31 percent. Sources: Appendix E; 2023 staff report, Figures 5-1 and 5-2. Tag: Substantiated.
- PM2.5: targeted appliances emit 458 tons a year of primary PM2.5, about 4 percent of the Bay Area's 12,530 tons. Source: Appendix E. Tag: Substantiated.
What the rules remove, and when (staff projections; burnout-only means a slow ramp):
- Net NOx reductions for the 2023 package: 874 tons a year by 2030, 1,835 by 2035, 2,761 by 2040, and 3,236 by 2046, when staff expect full turnover (an 88 percent cut from the 3,690-ton baseline). Staff assume 13-year water heater and 18-year furnace lifetimes. Sources: 2023 staff report, Table 5-3; 2026 staff report, Table 4. Tag: Substantiated.
- As a share of the 2018 regional NOx inventory: about 1.3 percent by 2030, 2.6 percent by 2035, 4.0 percent by 2040, and 4.6 percent at full turnover. Tag: PolicyBombs arithmetic on district figures. The future inventory will be different (vehicle NOx keeps falling), so the share could be larger later; we found no sourced future inventory to test that.
- Water heaters (Rule 9-6) are 142 of the 874 tons in 2030 and 575 of the 3,236 at full turnover, about 18 percent. Furnaces and the rest of the package (mostly Rule 9-4) supply the other 82 percent: about 732 tons in 2030 and 2,661 tons at full turnover (PolicyBombs arithmetic on Table 4). The furnace rule was not delayed: Rule 9-4 still applies to units made after Jan 1, 2029, and staff "does not recommend extending the compliance date beyond 2029." Source: 2026 staff report. Tag: Substantiated.
After the Nov 4, 2026 amendments:
- The one-year delay cuts water-heater NOx reductions from 142 to 106 tons in 2030 and from 363 to 310 tons in 2035; by 2045 both paths reach 575 tons. Source: 2026 staff report, Table 5. Tag: Substantiated.
- Exemptions: staff say the exemptions put "approximately half of the initially estimated emissions reductions associated with Rule 9-6" potentially out of reach, while noting overlaps and possible voluntary switching. Half of 575 is about 288 tons a year. Source: 2026 staff report. Tag: Substantiated (staff estimate); the 288 is PolicyBombs arithmetic.
- Net result at full turnover: roughly 2,950 tons a year (3,236 minus about 288), or about 4.2 percent of the 2018 regional inventory, if half the water-heater benefit is lost. Tag: PolicyBombs arithmetic; an upper-bound loss by staff's own description.
What that does to the air people breathe (the district's model, CMAQ, 2018 meteorology):
- Annual NOx where people live drops 0.692 ppb on average (7.4 percent), with the biggest local drops (over 1 ppb) in San Francisco, Oakland, Berkeley, El Cerrito, Fremont and San Jose. Source: 2023 staff report, Table 5-6; Appendix E. Tag: Substantiated.
- Annual PM2.5 where people live drops 0.138 micrograms per cubic meter on average (from 8.534 to 8.397, 1.6 percent). Of that, 0.084 is secondary PM2.5 formed from NOx, the part the zero-NOx standard itself guarantees; 0.054 is primary soot that goes away only if people choose electric. Source: 2023 staff report, Table 5-6. Tag: Substantiated. For scale, the annual standard is 9.0. The district did not model what this does to the official design value at the San Pablo monitor. Tag: Gap.
- High-PM days: on monitor days with at least 30 micrograms per cubic meter observed, the modeled 24-hour PM2.5 drop averaged 0.68. Source: Appendix E. Tag: Substantiated.
- Ozone: on monitor days with ozone at 65 ppb or higher, modeled 8-hour ozone fell 0.021 ppb on average, about 0.03 percent of the 70 ppb standard, and was "sometimes higher" in the control case. The district's own conclusion: "no significant change in ozone." Source: Appendix E. Tag: Substantiated.
- Season: cold weather pushes ammonium nitrate (the main NOx-derived particle) into particle form, and heating emissions peak in winter. So the benefit leans toward winter particle pollution, not summer smog. Source: Appendix E. Tag: Substantiated (mechanism); a seasonal breakdown of the modeled benefit was not published in the documents we reviewed.
Health claims, checked against the method:
- What was modeled: the district's health numbers come from EPA's BenMAP-CE applied to the CMAQ results. The control case removes all 3,690 tons of targeted NOx (scaled from the full 4,267) and all 458 tons of primary PM2.5, for residential and commercial space and water heating together, at full turnover, with 2018 weather and population. Source: Appendix E; 2023 staff report. Tag: Substantiated.
- "As many as 85 premature deaths": 85 is the top of a 37 to 85 range for total PM2.5, which includes primary soot cut only if people choose electric. The NOx-driven (secondary PM2.5) range, the benefit the standard itself delivers, is 23 to 52 deaths a year. Source: 2023 staff report, Table 5-7. Tag: Substantiated. The press release uses the top of the broader range.
- "15,000 asthma attacks": the district's table lists 15,000 as "asthma symptoms/albuterol use" (9,200 for the NOx-driven part), and values all of them at $0.0059 million a year, about $5,900 in total. New asthma cases ("onset of asthma") are 110 a year (71 NOx-driven). Sources: 2023 staff report, Table 5-7; 2026 staff report, Table 7. Tag: Substantiated. Calling 15,000 symptom days and inhaler uses "asthma attacks" overstates the endpoint.
- "Up to $890 million" and "up to $160 million": the $400 to $890 million range values the full total-PM2.5 elimination case; premature deaths are $380 to $870 million of it, about 95 percent or more. The $160 million for water heaters is the $890 million top end scaled by the 18 percent water-heater share (0.18 times $890 million is about $160 million), and $112 million assumes the low-income exemption. Staff call these "a partial accounting" and kept the 2022 analysis without recalculation. Source: 2026 staff report, Tables 7 and 8. Tag: Substantiated; the 18 percent check is PolicyBombs arithmetic.
- Bottom line on method: these are modeled, full-turnover estimates for eliminating the whole targeted source sector, including commercial units and including primary PM2.5. They are not a measured effect, and they are larger than what the amended rule is projected to remove (about 2,950 net tons of NOx after exemptions versus 3,690 modeled). Applying the district's own proportional scaling to the NOx-driven range would give roughly 18 to 42 avoided deaths a year at full turnover, around 2046 or later. Tag: PolicyBombs arithmetic, not a district figure. The 2026 spokesperson figure of up to 16 deaths and $90 million for the amended water-heater rule (CalMatters) is consistent in scale with an 18 percent share of 85, but the method behind it was not published. Tag: Unverified method.
Countervailing emissions from the power grid:
- The district's 3,236-ton figure is already net of power-plant NOx under its assumptions: replacements are electric, Bay Area supply is a weighted 85 percent carbon- and NOx-free, and gas plants emit 5 ppm NOx (the district calls this conservative because most Bay Area plants are permitted at 2.5 ppm). Staff also expect "all incremental power generation needs will be met with renewable generation resources." Source: 2023 staff report, Section V.F and Table 5-2. Tag: Substantiated (as district assumptions).
- The tons of power-plant NOx added were not reported separately in the documents we fetched, and we did not find an official PG&E or CAISO marginal NOx rate for winter heating load to test the assumption. Winter night load (Section 3.10) is when solar is absent. Tag: Gap; no grid factor is estimated here.
Indoor air:
- The Air District does not claim indoor benefits from these vented appliances, and we found no quantified indoor NO2 or CO estimate for Bay Area furnaces or water heaters in the district record. The district's Appendix E cites a 2020 UCLA study on residential gas appliances and indoor and outdoor air, which mainly concerns unvented cooking. Tag: Gap (no number used).
What the clean-air evidence adds up to:
- The cut is real and permanent once units turn over: about 3,236 tons of NOx a year by 2046 before exemptions, roughly 2,950 after, or about 4 to 5 percent of 2018 regional NOx.
- It is slow: about 1.3 percent of regional NOx by 2030.
- It shows up mostly as fine particles in winter in the dense urban core, about 1.6 percent of population-weighted PM2.5. It does essentially nothing measurable for ozone, even though the region's ozone design value sits right at the 70 ppb standard.
- The headline health numbers describe the upper end of a modeled elimination case, not the adopted and amended rule's measured effect.
4. Good or bad for society?
The case for
- NOx from home furnaces and water heaters is a real source: 3,238 tons a year from homes in 2018, and residential plus commercial gas combustion is 31 percent of the stationary-source NOx the Air District regulates. At full turnover the rules remove about 3,236 tons a year (staff), and the district's model shows about 1.6 percent less population-weighted PM2.5 and 7.4 percent less NOx where people live, concentrated in the urban core. The region faces a likely nonattainment designation under the 9.0 annual PM2.5 standard (San Pablo design value 9.8), so permanent NOx cuts have regulatory value.
- Burnout-only rules avoid forced rip-outs and let the market and contractors scale.
- In this climate, heat pumps are efficient and add cooling, which matters more as heat waves increase.
- The 2026 amendments show the Board will adjust when costs and constraints are documented.
- Even at PG&E's high prices, a heat pump water heater costs less to run than a gas tank on every PG&E plan we checked (PolicyBombs arithmetic, Section 3.8).
- Outages do not make gas furnaces safer bets: central gas furnaces need electricity too (Air District FAQ).
- The statewide grid has had no Flex Alert since 2022 and carried a 2,547 MW summer surplus in 2026 (CAISO), and burnout timing spreads new load over years.
The case against
- On the district's own numbers, the water-heater rule costs households about $372.8 million a year against a top-end health value of up to $160 million a year (or $90 million per the spokesperson). That is a bad trade unless you believe the health values are badly understated.
- The furnace rule is the big-ticket item for families ($10,775 to $14,061 more before rebates) and the big source of claimed health benefit, but it is still on the books for 2029 with cost math that counted federal money that no longer exists.
- Exemptions make the water-heater rule bearable but halve its pollution benefit, add a self-attestation portal, and add about $3 million a year in administrative cost funded by fees on constrained homeowners. That is a lot of bureaucracy for half a policy.
- Renters cannot claim the income exemption and pay through rent.
- Bill savings for water heaters are small (about $50 a year in the district's analysis), so the "pays for itself" story does not hold for the typical household.
- Power bills: PG&E's residential average was 40.6 cents per kWh in March 2026, more than double the 18.16-cent U.S. average (EIA, Aug 2026), and the CPUC projects 4 to 6 percent yearly increases through 2029. The district's own Task 1 study found most residents on standard time-of-use rates did not see savings. A heat pump furnace may cost more to run than a 95 percent gas furnace on PG&E's default plan (Section 3.8), on top of a $14,061 upfront premium.
- Outages: North Bay and Sonoma customers averaged 12 to 13 hours without power in 2024, and PSPS shutoffs still hit Alameda, Contra Costa, Napa and Sonoma customers for days in October 2026. A conventional gas tank keeps making hot water in a multi-day outage; a heat pump water heater stays hot only for hours. The 2026 exemptions do not address outage-prone areas.
- Hidden grid costs: panel and service upgrades ($1,000 to $60,000 or more for service, per the district's study) fall on the household, and feeder and substation upgrades fall on all ratepayers, whose rates already rank among the nation's highest.
- The clean-air payoff is modest and slow: about 1.3 percent of 2018 regional NOx by 2030 and about 4 to 5 percent at full turnover around 2046 or later, no significant ozone change on the district's own model, and health headlines (85 deaths, 15,000 "asthma attacks") taken from the top of a modeled elimination case rather than the amended rule's projected effect. Vehicles and off-road engines produce 75 percent of regional NOx.
- Opportunity cost: the same dollars as voluntary rebates targeted at the oldest, dirtiest units (or at furnaces, where most NOx is) would likely buy more clean air per dollar than a mandate with a 50 percent off-ramp. This is our judgment, not a district finding.
Verdict
MIXED, leaning BAD for families as written. Unchanged after defining and measuring the clean-air benefit: the benefit is real, permanent and concentrated where people are most exposed, which keeps this from being a BAD verdict outright, but it is small (about 1.6 percent of population-weighted PM2.5, no significant ozone change) and arrives slowly, which does not offset the cost findings. Also unchanged after adding the electricity evidence, because that evidence cuts both ways: PG&E prices and hill-area outages hurt the case, while gas furnaces failing in outages too, cheaper-to-run heat pump water heaters, and a statewide grid with no Flex Alert since 2022 help it. On net it reinforces the furnace problem rather than changing the bottom line.
Keep the NOx-reduction goal and the burnout-only design. But the Board should (1) re-cost Rule 9-4 furnaces now, without the expired federal credit and the fully reserved HEEHRA rebate, and with bills re-run at 2026 PG&E tariffs on the default plan as well as E-ELEC, before 2029 locks in; (2) publish exemption-portal audit data once it opens; (3) give renters a path; (4) be honest that, on its own numbers, the water-heater piece costs more than it saves; and (5) consider outage-prone areas (frequent PSPS and storm outages) in exemption design, and say plainly who pays for service and transformer upgrades; and (6) report the rules' clean-air effect in the official metrics (tons of NOx by year, and modeled change in PM2.5 and ozone against the standards) for the amended rules, and stop citing whole-sector elimination figures and "asthma attacks" as if they were the rule's effect.
5. Politicians and parties for and against
Note: Air District board seats are held by local elected officials in nonpartisan offices; we list party only where it is a partisan office and well documented.
For (sponsored, voted for, or publicly defended):
- March 15, 2023 AYES (Board Resolution 2023-03): Margaret Abe-Koga, Brian Barnacle, John J. Bauters (Chair; made the motion), Ken Carlson, Noelia Corzo, Joelle Gallagher, John Gioia, Juan Gonzalez, Erin Hannigan, Lynda Hopkins, Davina Hurt, Tyrone Jue, Otto Lee, Sergio Lopez (seconded), Myrna Melgar, Nate Miley, Katie Rice, Mark Ross, Vicki Veenker, Steve Young.
- Lynda Hopkins, Sonoma County Supervisor and 2026 Board Chair: "This decision protects public health and respects what households can manage." (Air District press release, Nov 4, 2026.)
- John Gioia, Contra Costa County Supervisor, voted for the 2026 amendments: "the exemptions are big enough to drive a truck through." (CalMatters.)
- Lena Tam, East Bay board member: "if we can reduce harm with this rule, we should do it." (KQED.)
- Vicki Veenker (Palo Alto Mayor), Noelia Corzo (San Mateo County Supervisor), Chris Clark (Mountain View Councilmember), and Linda Sell (Sunnyvale Councilmember) were reported as supporters. (Palo Alto Daily Post.)
- Gov. Gavin Newsom (D): set a 6 million heat pumps by 2030 goal in a July 22, 2022 letter to CARB. A state agency official sent a letter backing the Bay Area rule (CalMatters; official not named in the article).
- Sen. Scott Wiener (D): author of SB 222 (heat pump permit streamlining), signed September 2026 per the Air District staff report.
Against or skeptical:
- Ray Mueller, San Mateo County Supervisor: abstained in 2023; in 2026 said he wished the board could repeal the rule and walked out ("We were basically boxed in"). (Resolution 2023-03; CalMatters; Palo Alto Daily Post.)
- Shamann Walton, San Francisco Supervisor: voted no on Nov 4, 2026; called the rule an unfunded mandate straining working-class families. (CalMatters; San Francisco Chronicle.)
- Steve Young, Benicia Mayor: voted for in 2023; abstained in 2026. (CalMatters.)
- Housing groups: California Apartment Association (Joshua Howard), San Francisco Apartment Association (Aug 13, 2026 letter), California Rental Housing Association (Adam Pearce).
- Federal: the Trump administration (R) Justice Department threatened to sue South Coast over similar rules in June 2025; U.S. Attorney Bill Essayli, a former Republican California Assemblymember, posted the warning. No federal action against the Bay Area rules has been reported.
Not found: a recorded position from Gov. Newsom specifically on BAAQMD Rules 9-4 or 9-6; a state law that directly mandates these rules (they are Air District regulations). Tag: Unverified/none found.
6. Gaps and unverified items
- Official November 4, 2026 roll call (minutes not yet posted). Pending.
- Separate Alameda County gas-appliance ordinance. Unverified (none found).
- Rule 9-4 furnace re-assessment and any 2029 date change. Pending.
- Commenter claims: 40 percent project non-completion; $230 to $450 a year in newer bill savings. Unverified.
- Exemption portal misuse rates: no data yet. Unverified.
- Name of the state official who wrote in support (CalMatters did not name them). Unverified.
- PG&E's 2025 annual reliability report (due to the CPUC July 15, 2026) was not available at PG&E's usual URL when we checked; 2025 division-level data are missing. We used the CPUC monitor's 2025 system figure (223.7 minutes). Pending.
- Annual PG&E PSPS totals for 2022 to 2025 were not compiled this run. Gap.
- Current Silicon Valley Power and Alameda Municipal Power residential rates; CCA generation rates. Not fetched (SVP site blocked our fetch). Unverified.
- A sourced Bay Area household hot-water and space-heating usage figure to turn the Section 3.8 per-therm comparison into dollars per year. Gap.
- Bay Area field data on real-world heat pump efficiency. Not in the district record we reviewed. Gap.
- Power-plant NOx added by the rules, reported separately from the 3,236-ton net figure, and an official marginal NOx rate for winter heating load. Not found. Gap.
- Quantified indoor NO2, CO or PM effects of vented gas furnaces and water heaters in Bay Area homes. Not found in the district record. Gap.
- Re-run of the air quality and health model for the 2026 amended Rule 9-6 (staff scaled the 2022 results instead), and any modeled change in official design values. Not published. Gap.
- Bay Area ozone and PM2.5 design values for 2022 to 2024 and 2023 to 2025 are marked incomplete in EPA's June 2026 tables at the area level; final 2024 annual PM2.5 designation. Pending.
- Method behind the 2026 spokesperson figure of up to 16 deaths and $90 million a year. Unverified.
References
- BAAQMD, Rules 9-4 and 9-6 Building Appliances page: https://www.baaqmd.gov/en/rules-and-compliance/rule-development/building-appliances
- BAAQMD press release 2026-041 (Nov 4, 2026): https://www.baaqmd.gov/~/media/files/communications-and-outreach/publications/news-releases/2026/2026_41_water-heater-rule-board-vote_approval-pdf.pdf
- BAAQMD Final Staff Report, Proposed Amendments to Rule 9-6 (Oct 2026): https://www.baaqmd.gov/~/media/dotgov/files/rules/reg-9-rule-4-nitrogen-oxides-from-fan-type-residential-central-furnaces/2021-amendments/documents/20261030-final-staff-report_rule-9-6-pdf.pdf
- ERG Socioeconomic Analysis for Amendments to Rule 9-6 (Oct 2026): https://www.baaqmd.gov/~/media/dotgov/files/rules/reg-9-rule-4-nitrogen-oxides-from-fan-type-residential-central-furnaces/2021-amendments/documents/20261030-rule9-6_waterheaters_socioeconomic-report_final-pdf.pdf
- BAAQMD memo, Small Water Heater Incremental and Total Upfront Costs (Oct 28, 2026): https://www.baaqmd.gov/~/media/dotgov/files/rules/reg-9-rule-4-nitrogen-oxides-from-fan-type-residential-central-furnaces/2021-amendments/documents/20261030-memo_small-water-heater-costs-comparison-with-other-data-final-pdf.pdf
- BAAQMD Response to Comments, Rule 9-6 (Nov 3, 2026): https://www.baaqmd.gov/~/media/dotgov/files/rules/reg-9-rule-4-nitrogen-oxides-from-fan-type-residential-central-furnaces/2021-amendments/documents/20261103-combined_rule-9-6-response-to-comments-pdf.pdf
- BAAQMD Myths vs. Facts (Sept 1, 2026): https://www.baaqmd.gov/~/media/dotgov/files/rules/reg-9-rule-4-nitrogen-oxides-from-fan-type-residential-central-furnaces/2021-amendments/documents/20260901-appliance-rules-myths-vs-facts-8312026r-pdf.pdf
- Rincon/E3, Installation Costs for Zero-NOx Space and Water Heating Appliances (Task 1, 2024): https://www.baaqmd.gov/~/media/files/community-health/building-appliance-implementation/task1_electrificationcosts-pdf.pdf
- Rincon, Zero-NOx Space Heating Market Assessment, Rule 9-4 (Aug 2026): https://www.baaqmd.gov/~/media/dotgov/files/rules/reg-9-rule-4-nitrogen-oxides-from-fan-type-residential-central-furnaces/2021-amendments/documents/20260831-t1-market-assessment-report-final-clean-pdf.pdf
- BAAQMD Board Resolution 2023-03 (vote record): https://www.baaqmd.gov/~/media/files/board-of-directors/adopted-resolutions/2023/2023_03_amending_9_4_and_9_6_and_certifying_ceqa_eir-pdf.pdf
- BAAQMD Board minutes, March 15, 2023: https://www.baaqmd.gov/~/media/files/board-of-directors/2023/bod_min_031523-pdf.pdf
- CalMatters, "New deadline for phaseout of gas water heaters gives Bay Area homeowners one more year" (Nov 2026): https://calmatters.org/environment/2026/11/bay-area-gas-water-heater/
- KQED, "Bay Area Air District Votes to Delay Zero-Emission Water Heater Rule" (Nov 4, 2026): https://www.kqed.org/science/2002537/bay-area-air-district-votes-to-delay-zero-emission-water-heater-rule
- Palo Alto Daily Post, Mueller walks out (Nov 5, 2026): https://padailypost.com/2026/11/05/air-districts-board-wasnt-given-the-option-to-repeal-ban-on-gas-water-heaters-mueller-walks-out/
- San Francisco Chronicle, gas water heater ban vote (Nov 2026): https://www.sfchronicle.com/bayarea/article/gas-water-heater-ban-vote-22509907.php
- Ninth Circuit, Rinnai America Corp. v. South Coast AQMD, No. 25-5129 (July 2, 2026): https://cdn.ca9.uscourts.gov/datastore/opinions/2026/07/02/25-5129.pdf
- California Apartment Association and SF Apartment Association letter (Aug 13, 2026): https://caanet.org/u/2026/08/caa-sfaa-bay-area-air-district-rule-9-6-opposition-letter-2026-08-13.pdf
- IRS FAQ, OBBB modifications to 25C and other credits: https://www.irs.gov/newsroom/faqs-for-modification-of-sections-25c-25d-25e-30c-30d-45l-45w-and-179d-under-public-law-119-21-139-stat-72-july-4-2025-commonly-known-as-the-one-big-beautiful-bill-obbb
- TECH Clean California, HEEHRA rebates status: https://techcleanca.com/incentives/heehrarebates/
- California Energy Commission, IRA residential rebate programs: https://www.energy.ca.gov/programs-and-topics/programs/inflation-reduction-act-residential-energy-rebate-programs
- Switch Is On, heat pump water heater rebate listing: https://www.switchison.org/incentives/10167
- CalMatters, South Coast rejects gas heater rules (June 6, 2025): https://calmatters.org/environment/2025/06/gas-water-heaters-furnaces-phaseout-la-basin-aqmd-rules/
- Governor Newsom letter to CARB (July 22, 2022): https://www.gov.ca.gov/wp-content/uploads/2022/07/07.22.2022-Governors-Letter-to-CARB.pdf
- Inside Climate News, Berkeley gas ban and reach codes (Sept 30, 2024): https://insideclimatenews.org/news/30092024/california-cities-new-buildings-gas-bans-lawsuit/
- KQED, San Mateo and Contra Costa pause gas bans: https://www.kqed.org/science/1991664/san-mateo-contra-costa-pause-natural-gas-bans-for-new-buildings
- PG&E Electric Rate Advisory, March 1, 2026: https://www.pge.com/assets/pge/docs/account/rate-plans/electric-rate-advisory-0326.pdf
- PG&E Electric Rate Advisory, Jan 1, 2026: https://www.pge.com/assets/pge/docs/account/rate-plans/electric-rate-advisory-0126.pdf
- PG&E Electric Rate Advisory, Sept 1, 2025: https://www.pge.com/assets/pge/docs/account/rate-plans/electric-rate-advisory-0925.pdf
- PG&E Electric Rate Advisory, March 1, 2025: https://www.pge.com/assets/pge/docs/account/rate-plans/electric-rate-advisory-0325.pdf
- PG&E Electric Rate Advisory, Jan 1, 2025: https://www.pge.com/assets/pge/docs/account/rate-plans/electric-rate-advisory-0125.pdf
- PG&E Electric Rate Advisory, Oct 1, 2024: https://www.pge.com/assets/pge/docs/account/rate-plans/electric-rate-advisory-1024.pdf
- PG&E Electric Rate Advisory, Sept 1, 2024: https://www.pge.com/assets/pge/docs/account/rate-plans/electric-rate-advisory-0924.pdf
- PG&E Electric Schedule E-TOU-C: https://www.pge.com/tariffs/assets/pdf/tariffbook/ELEC_SCHEDS_E-TOU-C.pdf
- PG&E Electric Schedule E-ELEC: https://www.pge.com/tariffs/assets/pdf/tariffbook/ELEC_SCHEDS_E-ELEC.pdf
- PG&E Gas Schedule G-1 (effective Nov 1, 2026): https://www.pge.com/tariffs/assets/pdf/tariffbook/GAS_SCHEDS_G-1.pdf
- CPUC Electric Affordability page: https://www.cpuc.ca.gov/industries-and-topics/electrical-energy/electric-rates/electric-affordability
- CPUC Fact Sheet, California Electric and Natural Gas Rates (Oct 28, 2026): https://www.cpuc.ca.gov/-/media/cpuc-website/industries-and-topics/documents/energy/electric-energy/rates-and-grc-materials/2026-rates-reports-factsheet.pdf
- EIA Electric Power Monthly, Table 5.6.A (August 2026 data): https://www.eia.gov/electricity/monthly/epm_table_grapher.php?t=epmt_5_6_a
- EIA, California average residential natural gas price (annual): https://www.eia.gov/dnav/ng/hist/n3010ca3a.htm
- City of Palo Alto Utilities Rates: https://www.paloalto.gov/Departments/Utilities/Customer-Service/Utilities-Rates
- 10 CFR 430.32 (federal furnace and water heater efficiency standards): https://www.ecfr.gov/current/title-10/chapter-II/subchapter-D/part-430/subpart-C/section-430.32
- DOE, 2023 central air conditioner and heat pump standards FAQ: https://www1.eere.energy.gov/buildings/appliance_standards/pdfs/2023_CAC_Standards_FAQ_10-5-2022_Final.pdf
- ENERGY STAR water heater key product criteria: https://www.energystar.gov/products/water_heaters/residential_water_heaters_key_product_criteria
- PG&E 2024 Annual Electric Reliability Report (submitted July 15, 2025): https://www.pge.com/assets/pge/docs/about/pge-systems/2024-annual-electric-reliability-report.pdf
- CPUC PG&E Independent Safety Monitor Status Update Report (May 26, 2026): https://www.cpuc.ca.gov/-/media/cpuc-website/divisions/safety-policy-division/reports/ism-status-update-report-8.pdf
- EIA, "Hurricanes in 2024 led to the most hours without power in the United States in 10 years" (Dec 1, 2025): https://www.eia.gov/todayinenergy/detail.php?id=66744
- PG&E PSPS briefing to the CPUC (Feb 2022): https://www.cpuc.ca.gov/-/media/cpuc-website/divisions/safety-and-enforcement-division/meeting-documents/psps-briefings-february-2022/pge-psps-briefing-presentation-feb-2022.pdf
- NBC Bay Area / Bay City News, PSPS restoration (Oct 16, 2026): https://www.nbcbayarea.com/news/local/pge-power-shutoffs-restoration-bay-area/4160293/
- KTVU, PG&E storm outages (Dec 25, 2025): https://www.ktvu.com/news/pge-storm-outages-check-see-power-is-out-your-area
- CAISO Grid Emergencies History Report (rev. Oct 9, 2026): https://www.caiso.com/documents/grid-emergencies-history-report-1998-to-present.pdf
- CAISO 2026 Summer Loads and Resources Assessment: https://www.caiso.com/documents/2026-summer-loads-and-resources-assessment.pdf
- CAISO 2026 Summer Assessment overview page: https://www.caiso.com/generation-transmission/resource-adequacy/2026-summer-loads-and-resources-assessment
- CAISO 2025 Statistics: https://www.caiso.com/documents/2025-statistics.pdf
- CEC 2025 IEPR forecast, updated results (Jan 5, 2026): https://www.energy.ca.gov/sites/default/files/2026-01/2026-01-05_DAWG_Mtg_Slides-Combined_ada.pdf
- E3 for BAAQMD, Electric Infrastructure Impacts from Proposed Zero NOx Standards (Appendix D, Dec 2022): https://www.baaqmd.gov/~/media/dotgov/files/rules/reg-9-rule-4-nitrogen-oxides-from-fan-type-residential-central-furnaces/2021-amendments/documents/20221220_sr_appd_rg09040906-pdf.pdf
- ADE for BAAQMD, Socioeconomic Report on Rules 9-4 and 9-6 (Appendix C, Dec 2022): https://www.baaqmd.gov/~/media/dotgov/files/rules/reg-9-rule-4-nitrogen-oxides-from-fan-type-residential-central-furnaces/2021-amendments/documents/20221220_sr_appc_rg09040906-pdf.pdf
- BAAQMD Final Staff Report, Rules 9-4 and 9-6 (March 2023): https://www.baaqmd.gov/~/media/dotgov/files/rules/reg-9-rule-4-nitrogen-oxides-from-fan-type-residential-central-furnaces/2021-amendments/documents/20230307_fsr_rules0904and0906-pdf.pdf
- Rincon/E3 for BAAQMD, Grid Reliability and Interconnection Challenges (Sept 2024): https://www.baaqmd.gov/~/media/files/community-health/building-appliance-implementation/grid-impacts-final-pdf.pdf
- BAAQMD Appendix E, Air Quality and Health Impacts modeling for Rules 9-4 and 9-6 (Dec 2022): https://www.baaqmd.gov/~/media/dotgov/files/rules/reg-9-rule-4-nitrogen-oxides-from-fan-type-residential-central-furnaces/2021-amendments/documents/20221220_sr_appe_rg09040906-pdf.pdf
- BAAQMD, Air Quality Standards and Attainment Status: https://www.baaqmd.gov/about-air-quality/research-and-data/air-quality-standards-and-attainment-status
- EPA, Air Quality Design Values (2025 reports, June 2026): https://www.epa.gov/air-trends/air-quality-design-values
- EPA ozone design values 2023 to 2025: https://www.epa.gov/system/files/documents/2026-06/o3_designvalues_2023_2025_final_06_08_26.xlsx
- EPA PM2.5 design values 2023 to 2025: https://www.epa.gov/system/files/documents/2026-06/pm25_designvalues_2023_2025_final_06_12_26.xlsx
- EPA NO2 design values 2023 to 2025: https://www.epa.gov/system/files/documents/2026-06/no2_designvalues_2023_2025_final_06_02_26_0.xlsx
- CARB, State recommendation for the 2024 annual PM2.5 NAAQS: https://www.epa.gov/system/files/documents/2026-09/ca_state-recommendation.pdf
- EPA Region 9 letter to California on 2024 PM2.5 designations (Sept 29, 2026): https://www.epa.gov/system/files/documents/2026-10/region-9_california_120-day-letter_2026.pdf
- BAAQMD FAQ, Appliance Rules (July 2026): https://www.baaqmd.gov/~/media/dotgov/files/rules/reg-9-rule-4-nitrogen-oxides-from-fan-type-residential-central-furnaces/2021-amendments/documents/20260713_faq_appliance_rules_07062026-pdf.pdf
PolicyBombs · Policy #76. Follow @PolicyBombs on X.
Accountability Scorecard
MixedPolicy #76 grade: Mixed. MIXED, leaning BAD for families as written. The clean-air gain is real but modest. The bill lands on homeowners and renters, and a ducted heat pump costs $14,061 more than a new gas furnace in a Bay Area home, before rebates, per the Air District's own study.
Measured outcome: $14,061 more for a ducted heat pump than a new gas furnace in a Bay Area home, before rebates (Air District study). Gas furnaces produced after Jan 1, 2029 and water heaters after Jan 1, 2028 are affected.
Positions on record
Responsible parties being sourced. Names appear here only once they are tied to a documented action with a source.
How we grade
Grades come from the "good or bad for society" verdict (question 4) in each PolicyBomb research pack and rest on measured outcomes, not motives. Harmful means the research found net harm, Mixed means real benefits and real costs, Helpful means net benefit. Every name is tied to a documented action (an authored bill, a signature, a recorded vote, a filed donation, an order or a public statement) with a linked source. Only full scorecard rows count toward a person's Harmful, Mixed and Helpful tally; positions listed from the research are shown with their source but are not tallied yet.
Grade basis: Day 76 Bay Area natural gas elimination pack, verdict.