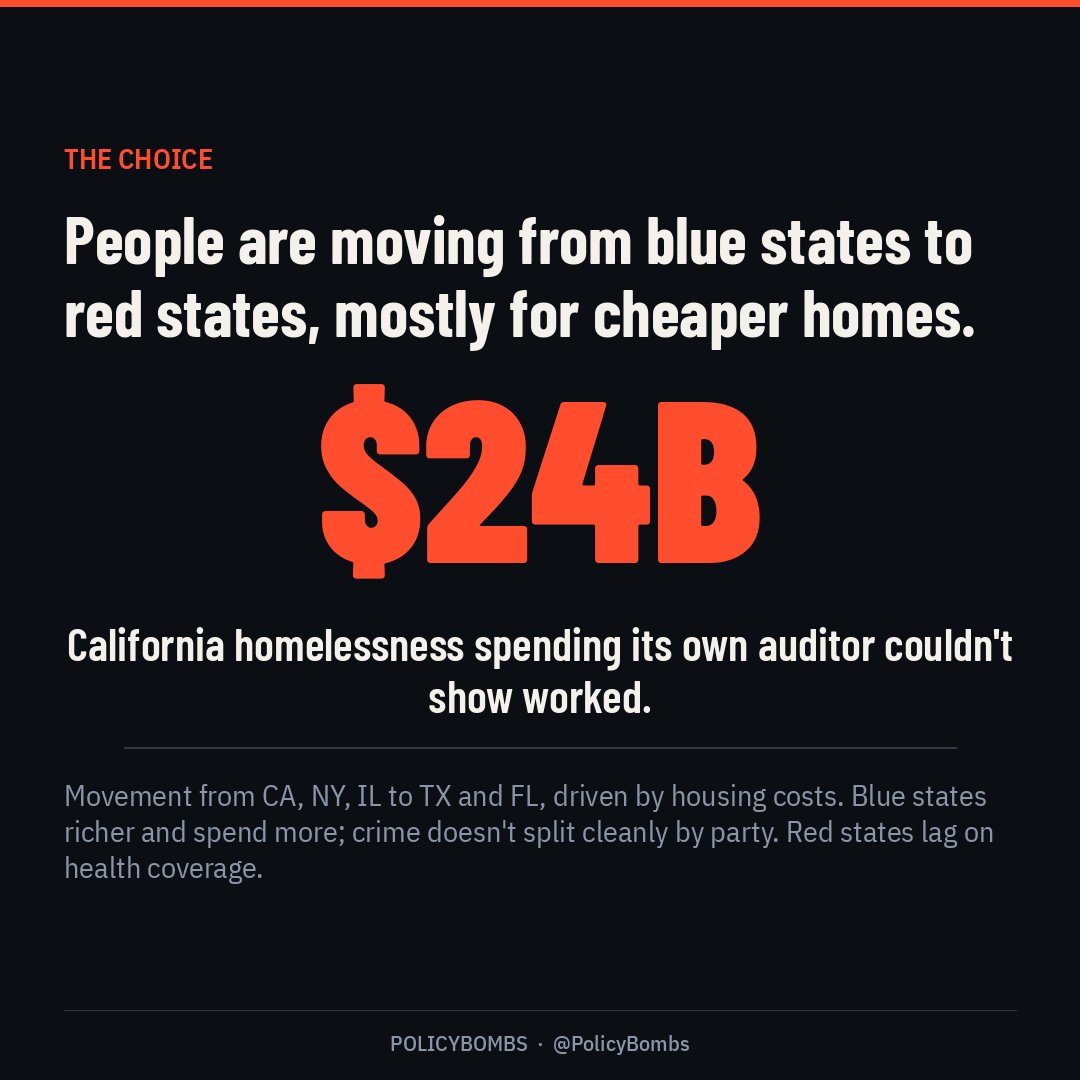
$24 billion. California's own auditor couldn't show whether that much homelessness spending worked.
People are steadily moving from California, New York and Illinois to Texas and Florida, mostly because of housing costs. Blue states are richer and spend more. Crime does not split cleanly by party. Red states have their own accountability problems, but the main ones checked were cleared in court or by auditors.
The good: Red states win on affordability and growth. The cost: Red states lose on health coverage and some public-health outcomes.
PRO: Red states win on affordability and growth.
CON / COST: Red states lose on health coverage and some public-health outcomes.
SOCIETY: Blue-state housing policy is clearly bad; 'Democrats ruin states' overreaches.
Full analysis
Democratic vs Republican Governance: CA, IL, NY vs TX, FL
Tests the claim that Democratic policy harms cities and states, comparing one-party blue and red states on migration, cost, housing, crime, taxes and budgets with confounders stated. As of Nov 4, 2026.
Content as of Nov 4, 2026, 8:33 PM ET. Source Page: PolicyBombs canvas
Long-form deep analysis. Companion to the 10-minute quick reference (14-red-vs-blue-states-summary.docx).
Contents
- 10-Minute Voter Guide
- Key facts
- Net domestic migration, July 2024 to June 2025
- Crime rates, 2024
- 1. What is the policy
- 2. Why it exists
- 3. Realized effects
- 4. Good or bad for society
- Local investigations and data anomalies
- Who supports / who opposes
- References
10-Minute Voter Guide
Who’s for / against: Blue-state model champions: Gov. Newsom (D-CA), who also led Prop 50 redistricting in response to Texas. Red-state model champions: Govs. DeSantis (R-FL) and Abbott (R-TX), who signed the 2025 mid-decade Texas map. The two models clashed on Fox in the Nov 2023 Newsom–DeSantis debate.
People are steadily moving from California, New York and Illinois to Texas and Florida, mostly because of housing costs. Blue states are richer and spend more, but California’s own auditor found the state couldn’t show whether $24 billion in homelessness spending worked. Crime does not split cleanly by party. Red states have their own accountability problems, but the main ones checked here were cleared in court or by auditors.
Blue-state model: strengths | Blue-state model: weaknesses |
+ Higher wages and productivity + Broader health coverage + Lower murder rate in NY | – Very high housing costs from building restrictions – Big spending without tracked results (CA homelessness audit) – Worst pension debt (IL) |
Bottom line for voters: Ask any candidate how many homes their policies will let get built, and whether they will publish results for every major spending program. |
Bottom line: The strongest evidence against blue-state governance is about housing and cost. Land-use restrictions in CA and NY made homes scarce and expensive, and that drives the steady domestic out-migration. Crime does not divide cleanly by party. Several red states have higher murder rates. The blue states also stay richer and more productive. Democrats’ clearest self-inflicted failure is blocking housing, not the general idea of "Democratic policy." |
Key facts
Measure | CA | NY | IL | TX | FL |
|---|---|---|---|---|---|
Top state income tax rate | 13.3% (+1.1% SDI on wages) | 10.9% | 4.95% flat | 0% | 0% |
Domestic migration, 2020–24 direction (Census) | Net loss | Net loss | Net loss | Net gain | Net gain |
Housing cost vs US | Among highest | High (NYC metro) | Near average | Near/below average; rising | Above average; insurance surge |
Population trend, 2024–25 | Slight growth via immigration | Slight growth via immigration | Flat | Fast growth | Fast growth |
Party control (2026) | D trifecta | D trifecta | D trifecta | R trifecta | R trifecta |
Net domestic migration, July 2024 to June 2025
Chart data (shown as a chart on the Page)
Label | Value |
|---|---|
California | −229,077 |
New York | −137,586 |
Illinois | −40,017 |
Florida | +22,517 |
Texas | +67,299 |
Census Vintage 2025 estimates (movers between states only; excludes international migration). Florida’s inflow has slowed sharply from its 2022 peak.
Crime rates, 2024
State | Party | Violent crime per 100K | Murder per 100K |
|---|---|---|---|
California | D | 486.0 | 4.5 |
Texas | R | 389.4 | 5.2 |
New York | D | 380.2 | 2.7 |
Illinois | D | 289.2 | 5.8 |
Florida | R | 267.1 | 3.9 |
FBI 2024 reported offenses, as compiled by secondary tables (OpenCrime, Exiled Policy); spot-check against the FBI Crime Data Explorer before quoting. Florida’s reporting coverage to the FBI has been incomplete in some recent years. Party split: California has the highest violent-crime rate, while New York has the lowest murder rate of the five.
1. What is the policy
Item | Detail |
|---|---|
Blue model (CA, NY, IL) | Progressive income taxes, higher minimum wages (CA $16.50 in 2025; fast-food $20), expansive Medicaid and social programs, strict environmental review (CEQA), rent regulation (NYC), strong public-sector unions with large pension obligations (IL most underfunded), and restrictive local zoning. |
Red model (TX, FL) | No income tax, higher property taxes (TX) or sales and tourism taxes (FL), lighter permitting and land-use rules, right-to-work, fewer social programs (neither expanded Medicaid), and state preemption of blue cities (e.g., TX HB 2127, 2023). |
Cities | Most large cities in both red and blue states are run by Democrats (Houston, Dallas, Austin, Miami-Dade until 2022). So city-level comparisons by party usually compare blue cities to other blue cities. |
2. Why it exists
Blue-state drivers: urban and coastal coalitions, public-sector unions, environmental groups, and incumbent homeowners. Homeowners use zoning and CEQA to protect home values, a bipartisan local behavior that blue metros practice most. High-income tax bases (tech, finance) make progressive taxes feasible, but they also make revenue volatile.
Red-state drivers: business lobbies, growth coalitions, oil and gas revenue (TX), retirees and tourism (FL), and competition for movers by marketing low taxes.
3. Realized effects
Item | Detail | Assessment |
|---|---|---|
Migration | Census shows sustained net domestic out-migration from CA, NY and IL and inflow to TX and FL since at least 2010, accelerated in 2020–22. IRS migration data shows leavers skew middle-income, consistent with housing costs as the main push. | Blue negative |
Housing | CA and NY permit far fewer homes per capita than TX and FL. Research (Glaeser and Gyourko; Hsieh and Moretti) ties high coastal prices mainly to supply restrictions. CA’s 2023–25 YIMBY laws (SB 9, SB 35, 2025 CEQA reform) are recent. | Blue negative |
Crime | FBI data: violent-crime and murder rates do not divide by party. Third Way (2023) found higher per-capita murder rates in states Trump won. Big-city crime fell in both red and blue areas in 2023–25. City-level spikes (SF property crime, Chicago homicide) are real but local. | No clean split |
Fiscal health | IL has the worst pension funding (43.3% funded in 2023, lowest in the US per Pew) and history of credit downgrades, though it was upgraded 2021–24. CA has volatile capital-gains revenue and recurring deficits. TX and FL hold large rainy-day funds. Blue states send more money to Washington than they get back. | Mixed |
Prosperity | CA and NY have higher GDP per capita and median wages, but after housing costs their poverty rates (Census Supplemental Poverty Measure) rank among the highest; CA’s is the highest. FL lacks Medicaid expansion and has a larger uninsured share; TX has the highest uninsured rate in the US. | Trade-off |
Confounders: climate and retiree preferences (FL), energy booms (TX), coastal agglomeration (CA, NY), remote work after 2020, and the 2017 SALT cap, which raised effective taxes for high earners in blue states. Partisan control is not randomly assigned, so the evidence is correlational.
4. Good or bad for society
Verdict: Blue-state housing and permitting policy is clearly bad. It is the strongest support for the claim and explains much of the cost-of-living gap and out-migration. On crime, overall prosperity and safety nets, the evidence does not support a blanket "Democratic policies ruin states" claim. Red states win on affordability and growth, and lose on health coverage and some public-health outcomes. |
Case for the claim | Case against |
+ Decade-plus of residents voting with their feet + Housing scarcity created by policy, plus very high cost of living + IL pension debt; CA homelessness (largest in US) despite large spending | – Blue states remain the most productive economies; growth is not the same as welfare – Crime and murder are not higher in blue states overall – Red-state growth partly reflects cheap land and climate, not only policy |
- Blue states: legalize housing (by-right permitting, CEQA limits).
- Red states: invest in health coverage and infrastructure for growth.
- Judge outcomes by specific policies, not party labels.
Local investigations and data anomalies
Finding | Source | What investigators or courts concluded |
|---|---|---|
CA allocated about $24B to homelessness and housing (FY2018-19 to 2022-23) but stopped tracking statewide spending after FY2020-21; 3 of 5 programs reviewed lacked outcome data to judge | California State Auditor 2023-102.1, Apr 2024 | Only Homekey and CalWORKs Housing Support appeared cost-effective; no fraud finding, but an accountability failure |
Illinois pensions 43.3% funded (2023), lowest in US | Pew | Structural underfunding, not fraud |
Texas Operation Lone Star: $11B+ border spending, much via emergency no-bid contracts (Texas Observer, Houston Chronicle) | Texas State Auditor 27-005, Oct 2026 | Sampled $282M in payments on 3 contracts were accurate and supported; one routine janitorial contract improperly treated as emergency |
Florida: $10M from a Medicaid settlement routed to the Hope Florida Foundation, then to political committees | Leon County grand jury, 2025 | Grand jury said the money was misappropriated but indicted no one; 1st DCA ordered the report expunged in Oct 2026, ruling the funds were not public money |
Verdict: unchanged, and sharpened. The strongest documented accountability failure is California’s untracked homelessness spending. Red-state anomalies were real enough to investigate, but auditors or courts cleared them on the record.
Further reading (also listed in References):
- CA State Auditor: Homelessness in California (2024) — auditor.ca.gov
- Texas SAO: Contracting at Texas Military Department (Oct 2026) — sao.texas.gov
- WFLA: court orders Hope Florida grand jury report expunged — wfla.com
Who supports / who opposes
For = championing their own state model or map. Each row cites a numbered source below. Checked Nov 4, 2026.
Who | Party / level | Position | Evidence | Ref |
Gov. Gavin Newsom (D-CA) | Democrat | For | Championed Prop 50 (Nov 4, 2025) for temporary legislature-drawn maps to counter Texas; passed 64% | [1] |
Gov. Greg Abbott (R-TX) | Republican | For | Signed HB 4 (2025 special session), a mid-decade congressional map aimed at +5 GOP seats | [2] |
Newsom vs. Gov. Ron DeSantis (R-FL) | Both | Mixed | Debated state models on Fox News (Nov 30, 2023) | [3] |
Cross-party defectors: Prop 50 was opposed by former Gov. Arnold Schwarzenegger (R), who backed independent redistricting.
How positions shifted: Both parties used to back independent redistricting commissions in some form (CA voters created one in 2008 and 2010). In 2025 both turned to mid-decade partisan maps.
Not included or not fully verified: This is a comparison topic, so there is no single bill. Rows cover the leaders of each model. The Schwarzenegger opposition to Prop 50 was not re-opened this turn.
Sources for this section:
- [1] AP: California voters approve new US House map (Prop 50) (apnews.com) https://apnews.com/article/california-redistricting-prop-50-gavin-newsom-839193bfc2a817086acca7365315f26f
- [2] Texas Legislature: HB 4, 89th Leg. 2nd Called Session (2025 congressional map) (capitol.texas.gov) https://capitol.texas.gov/BillLookup/History.aspx?LegSess=892&Bill=HB4
- [3] AP: DeSantis, Newsom debate on Fox (apnews.com) https://apnews.com/article/desantis-newsom-debate-fox-news-hannity-2024-d7695de79221caf80a730532c614c01f
References
[1] CA State Auditor: Homelessness in California (2024). auditor.ca.gov. https://www.auditor.ca.gov/reports/2023-102-1/
[2] Texas SAO: Contracting at Texas Military Department (Oct 2026). sao.texas.gov. https://sao.texas.gov/Reports/Main/27-005.pdf
[3] WFLA: court orders Hope Florida grand jury report expunged. wfla.com. https://www.wfla.com/news/florida/court-orders-full-expungement-of-hope-florida-grand-jury-report/
[4] Census state population estimates and components of change. census.gov. https://www.census.gov/programs-surveys/popest.html
[5] IRS SOI migration data. irs.gov. https://www.irs.gov/statistics/soi-tax-stats-migration-data
[6] Census Supplemental Poverty Measure. census.gov. https://www.census.gov/topics/income-poverty/supplemental-poverty-measure.html
[7] FBI Crime Data Explorer. cde.ucr.cjis.gov. https://cde.ucr.cjis.gov/
[8] Third Way: The Red State Murder Problem. thirdway.org. https://www.thirdway.org/report/the-red-state-murder-problem
[9] Tax Foundation: state individual income tax rates. taxfoundation.org. https://taxfoundation.org/data/all/state/state-income-tax-rates/
[10] Hsieh and Moretti: Housing constraints and spatial misallocation. aeaweb.org. https://www.aeaweb.org/articles?id=10.1257/mac.20170388
[11] Pew: State pension funding levels (Oct 2025; IL lowest at 43.3%). pew.org. https://www.pew.org/en/research-and-analysis/articles/2025/10/29/state-pension-funding-levels-stayed-stable-despite-volatility
[12] Census Vintage 2025 state components of change (CSV). census.gov. https://www2.census.gov/programs-surveys/popest/datasets/2020-2025/state/totals/NST-EST2025-ALLDATA.csv
[13] OpenCrime: state crime rates (FBI 2024 compiled). opencrime.us. https://www.opencrime.us/states
PolicyBombs · Day 58. Follow @PolicyBombs on X.