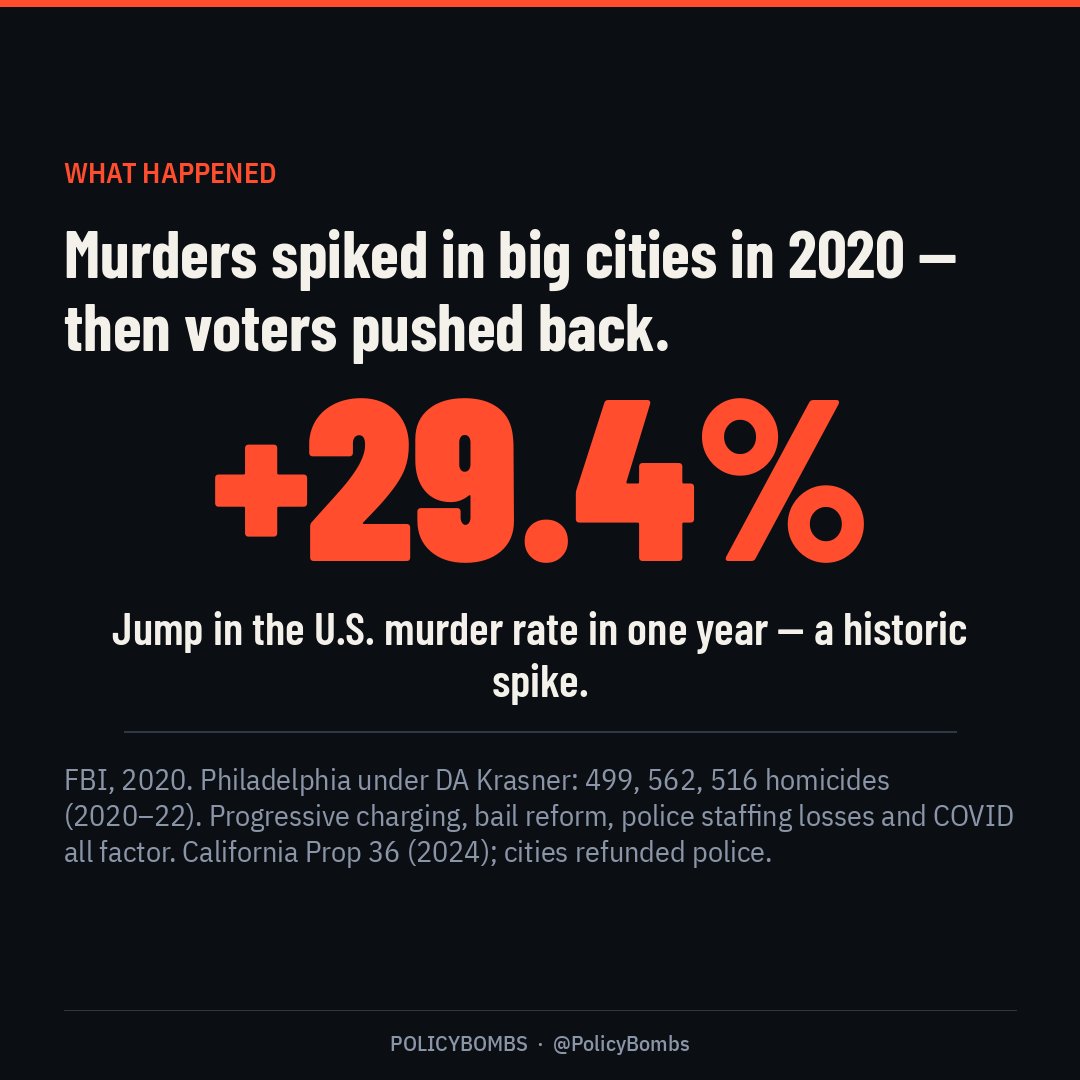
+29.4%: the 2020 jump in the U.S. murder rate, a historic spike (FBI). Philadelphia under DA Krasner recorded 499, 562 and 516 homicides in 2020, 2021 and 2022. Progressive charging, bail reform and police staffing losses all show up in the record, alongside COVID disruption. Voters corrected course: California passed Prop 36 in 2024, and cities refunded police.
PRO: Homicide rose in cities with and without progressive DAs; pandemic disruption was real.
CON / COST: Thousands of excess homicide victims; soft-on-theft regimes fed retail crime.
SOCIETY: BAD
Full analysis
Urban Crime Increases 2020–2022: Prosecutors, Staffing, Bail Reform
Homicide and retail-theft spikes in major cities 2020–22 — FBI +29.4% murder in 2020, Philly/Chicago peaks, progressive DA and bail-reform correlates, police staffing drops, and later partial reversals. New city-crime focus (overlaps prior climate/Soros pages). As of Nov 5, 2026.
Content as of Nov 5, 2026, 6:18 AM ET. Source Page: PolicyBombs canvas
Long-form deep analysis. Companion to the 10-minute quick reference (32-urban-crime-increases-summary.docx).
Contents
- 10-Minute Lazy Voter Guide
- 1. What is the policy
- 2. Why it exists
- 3. Realized effects
- City snapshots
- Who supports / who opposes
- 4. Good or bad for society
- References
- Gaps / unverified
10-Minute Lazy Voter Guide
Who’s for / against: Attributed spike to progressive policy: Republicans, police unions, victims’ advocates. Attributed to COVID/guns/Ferguson-effect only: many progressive researchers. Reality: multi-causal — policy choices on charging, bail, and staffing still matter. |
COVID-only / structural arguments | Policy-choice arguments |
+ Homicide rose in cities with and without progressive DAs + Pandemic disrupted social control and trafficking patterns + Some studies find modest/null DA effects on violence | – FBI: murder +29.4% in 2020 — historic – Philly under Krasner hit extreme per-capita homicide – Retail theft / Prop 47 dynamics + bail reform visible in clearance and recidivism complaints |
Verdict for voters: Bad years for urban safety. Denying any role for non-prosecution, bail leniency, and anti-police politics is advocacy. Denying COVID/guns is also incomplete. Voters who re-funded police and toughened theft laws read the body counts correctly. |
1. What is the policy
Item | Detail | Assessment |
|---|---|---|
Progressive charging | Declination memos, no-cash bail pushes, enhancement bans (Gascon, Bragg, Krasner, etc.). | Substantiated |
Police staffing | Budget cuts, resignations/retirements, recruiting collapse post-2020. | Substantiated pattern |
Bail reform | NY 2019 and similar — reduced pretrial detention for many offenses; later amendments. | Substantiated |
2. Why it exists
Stated reasons: racial equity; end mass incarceration; COVID public health.
Underlying drivers: 2020 protest politics; Soros-PAC DA wins; academic reform theories; pandemic emergency decrees. Corruption: soft capture of DA offices and city councils — see Soros prosecutors page. Street-level consequence: fewer cops, fewer detentions, more opportunistic crime.
3. Realized effects
Chart data (shown as a chart on the Page)
Label | Value |
|---|---|
US murder 2020 | +29.4% |
Philly 2021 | 562 homicides |
Metric | Figure | Source | Tag |
|---|---|---|---|
US murder rate change 2020 | +29.4% | FBI UCR | Substantiated |
US violent crime 2020 | +5.2% | FBI | Substantiated |
Philadelphia homicides 2020/21/22 | 499 / 562 / 516 | Philly PD | Substantiated |
National murder/violent crime 2022 | Declined from 2021 peaks (Brennan/FBI analyses) | Brennan Center / FBI | Substantiated |
Larceny/shoplifting 2022 | FBI: larceny up nearly 8% nationally in some analyses | Brennan summarizing FBI | Substantiated direction |
City snapshots
City | Note | Tag |
|---|---|---|
Chicago | Among highest large-city murder rates 2021–22 hot-spot analyses | Substantiated pattern |
Philadelphia | Peak 562 in 2021 under Krasner era | Substantiated |
NYC | Lower rates than Chicago/Philly but retail theft and shootings surged then fell | Substantiated |
LA | Homicide rise then partial decline; Gascon policy fights | Substantiated |
Academic caution: progressive prosecutors alone do not statistically explain the entire national spike. Political caution: cities that combined de-policing rhetoric + soft charging felt the pain acutely, and voters noticed.
Who supports / who opposes
Who | Party / level | Position | Evidence | Ref |
|---|---|---|---|---|
DA Larry Krasner | Democrat | For progressive non-prosecution model | Policies; resisted impeachment narrative | [1] |
DA George Gascon | Democrat | For declination/enhancement bans | Day-one directives; recalls failed on signatures | [2] |
Police unions | Labor | Against soft charging / defund | Public campaigns | [3] |
CA voters Prop 36 (2024) | Electorate | Against Prop 47-era theft leniency | Ballot passage | [4] |
FBI UCR | Federal stats | Documented 2020 spike | 2020 crime statistics release | [5] |
Further reading (also listed in References):
- [1] Philly PD crime statistics — phillypolice.com
- [2] Munk School progressive prosecution review — utoronto.ca
- [3] FBI 2020 crime statistics — fbi.gov
- [4] Ballotpedia Prop 36 — ballotpedia.org
- [5] Brennan Center on 2022 FBI data — brennancenter.org
4. Good or bad for society
Direct judgment: Bad. Thousands of excess homicide victims — disproportionately Black — during the spike years. Soft-on-theft regimes trained organized retail crime. Reversals (refund the police, Prop 36, DA recalls) are evidence-based corrections, not bigotry. |
- Staff police to clearance-rate targets
- Detain high-risk repeat violent offenders pretrial
- Prosecute organized retail theft rings
References
[1] [1] Philly PD crime statistics. phillypolice.com. https://www.phillypolice.com/crime-data/crime-statistics/
[2] [2] Munk School progressive prosecution review. utoronto.ca. https://munkschool.utoronto.ca/media/3097/download
[3] [3] FBI 2020 crime statistics. fbi.gov. https://www.fbi.gov/news/press-releases/fbi-releases-2020-crime-statistics
[4] [4] Ballotpedia Prop 36. ballotpedia.org. https://ballotpedia.org/
[5] [5] Brennan Center on 2022 FBI data. brennancenter.org. https://www.brennancenter.org/our-work/analysis-opinion/analyzing-fbis-national-crime-data-2022-eye-toward-2023-trends
[6] Wirepoints homicide hot spots 2022. wirepoints.org. https://wirepoints.org/wp-content/uploads/2023/02/Chicago-New-Orleans-were-the-nations-murder-capitals-in-2022-Wirepoints-Special-Report.pdf
[7] Vital City NYC crime 2022. vitalcitynyc.org. https://www.vitalcitynyc.org/vital-signs-march-2023/
Gaps / unverified
Item | Detail | Assessment |
|---|---|---|
Causal % attributable to DAs alone | Studies conflict; multi-causal. | Contested |
Exact national organized retail theft loss | Industry estimates vary widely. | Unverified single figure |
PolicyBombs · Day 32. Follow @PolicyBombs on X.